Blogs
82 posts on Power BI, Microsoft Fabric and semantic models, newest first. For undated, maintained guidance see the guides.
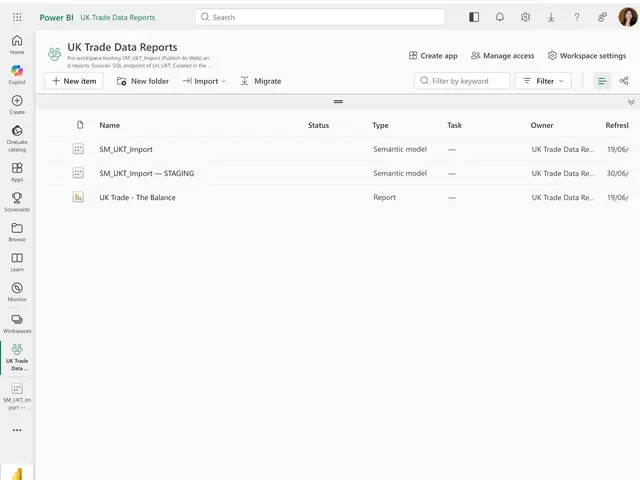 Microsoft FabricHow I make a semantic model Copilot-ready
A small open-source toolkit for making Microsoft Fabric semantic models Copilot-ready, rule-based descriptions, synonyms, safe renames, no AI calls.
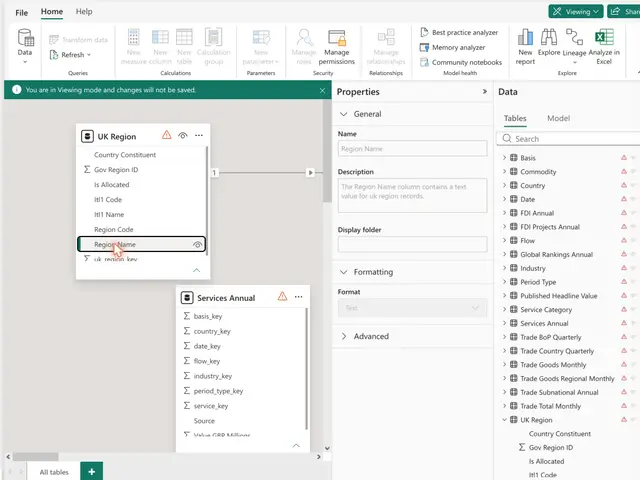 Microsoft FabricHow I add descriptions and synonyms to a model
A rule-based generator that adds plain-English descriptions and synonyms to a Fabric semantic model: safe, reviewable, and Copilot-ready in an afternoon.
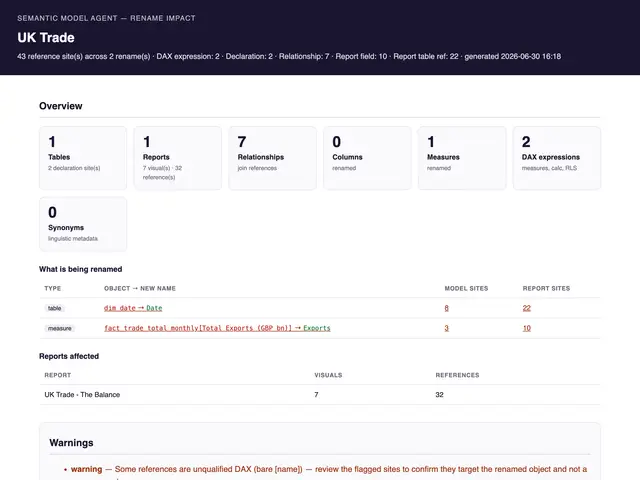 Microsoft FabricHow I rename a published model safely
Rename objects on a published Microsoft Fabric semantic model safely, with impact reports, DAX validation, and connected reports rewritten end-to-end.
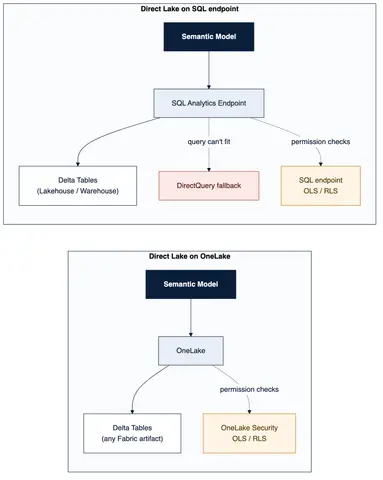 Microsoft FabricDirect Lake on OneLake just went GA. Here's how I'd audit and migrate.
Direct Lake on OneLake hit GA this month. The two flavours, the security shift you can't roll back, and a safe audit-validate-migrate workflow with
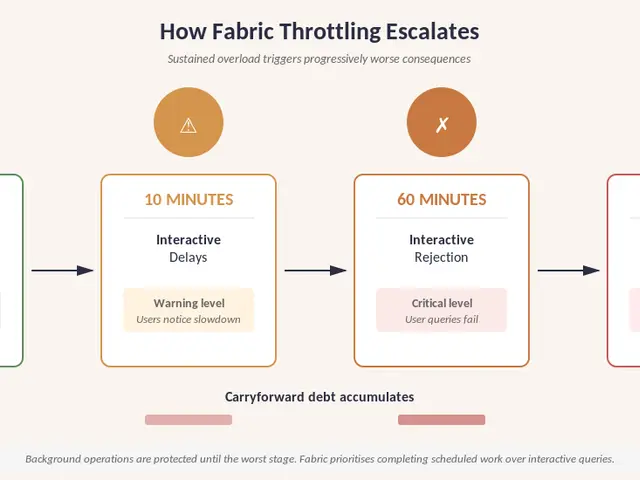 Microsoft FabricI Built a Tool to Size Fabric SKUs
Every Fabric project I've worked on, every single one, has had questions around SKU sizing, capacity, capacity metrics, monitoring, and utilisation.
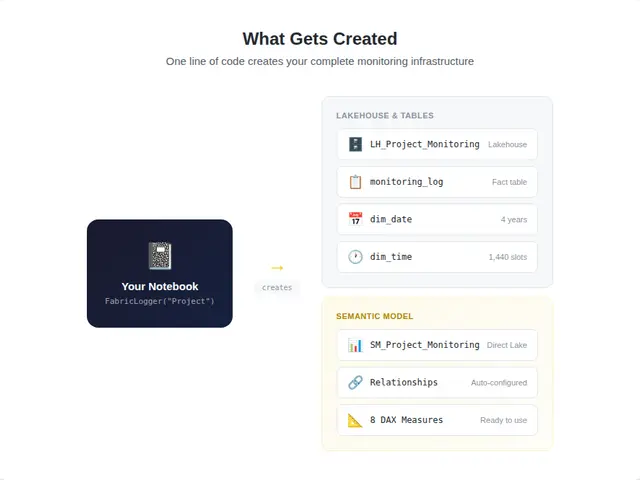 Microsoft FabricA Logging Framework for Microsoft Fabric
A single Python file that builds monitoring for a Microsoft Fabric project: a lakehouse, the tables, a semantic model with relationships, and DAX measures.
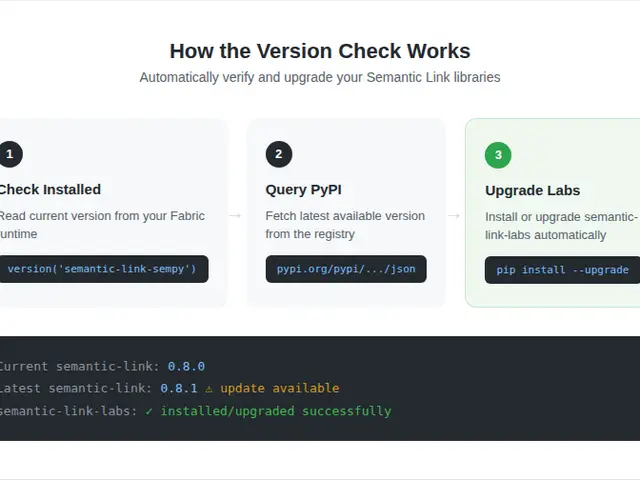 Semantic LinkKeep Your Semantic Link Libraries Up to Date in Fabric Notebooks
A snippet that checks the installed semantic-link version against PyPI and upgrades semantic-link-labs, so a Fabric notebook never runs a stale library.
 Agentic DevelopmentFrom Broken Blogs to Polished Posts, How I Built an AI Agent to Fix my Messy Content
How I built an AI agent to repair a botched blog import: what it fixed, how it works, and what I would do differently on the next content migration.
 Power BIDesigning with Intent: The Power of Visual Cues in BI Dashboards
Affordances, signifiers and the visual cues that make a dashboard readable, and the Power BI features that deliver them: formatting, icons, shadows, layout.
 REST APIA Quick Blog Post: Orphaned Deployment Pipelines
Recover a Fabric deployment pipeline nobody can open any more, with a short Python notebook that calls the update pipeline user REST API to add an owner.
 Power BIA Quick Blog Post – Converting Direct Lake to Import Mode (and Rebinding Reports)
Quick guide to convert Power BI Direct Lake models to Import mode and rebind reports using Semantic Link Labs. Perfect for publishing open d
 Power BIEfficiently Moving Items Between Workspaces with Fabric CLI
Copying Power BI reports or notebooks across Fabric workspaces isn’t exactly smooth, especially if you want to move things in bulk.
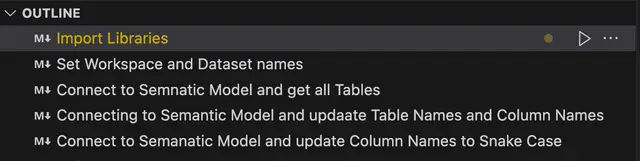 Semantic LinkUpdate Semantic Model column names with SemPy
SemPy offers many possibilities with Semantic Models in Microsoft Fabric, some of which are remarkably effective and simplify some tedious tasks.
 Power BIHow to Clone and Rebind Power BI Semantic Models
Clone a Power BI semantic model and its report, then rebind the copy to the new model, in three REST API calls you can run from a Fabric Python notebook.
 Power BICreate and maintain Semantic model measures and calculation groups using Sempy + Sempy Labs
Create, update and document semantic model measures and calculation groups from a Fabric notebook with Sempy and Semantic Link Labs, descriptions included.
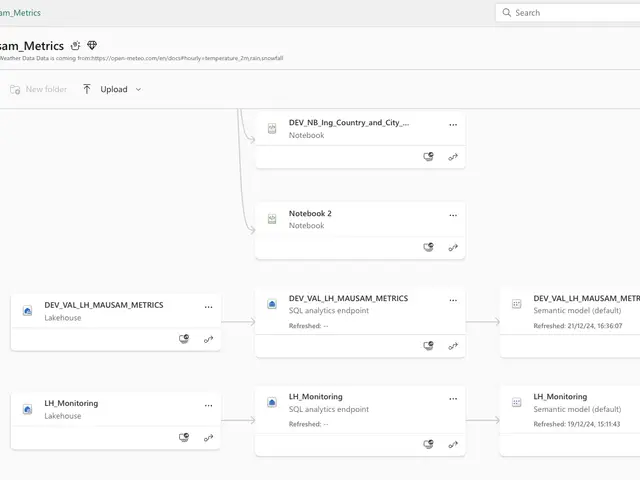 Microsoft FabricNaming Convention Ideas for Microsoft Fabric Developments
Naming conventions are a small but crucial part of creating effective data solutions. In this post, I explore how to do in Microsoft Fabric
 Microsoft FabricWrite Data to Unattached Lakehouses with Fabric Notebooks
Read and write across lakehouses your Fabric notebook is not attached to: mounting with NotebookUtils, writing straight to ABFS paths, and schema support.
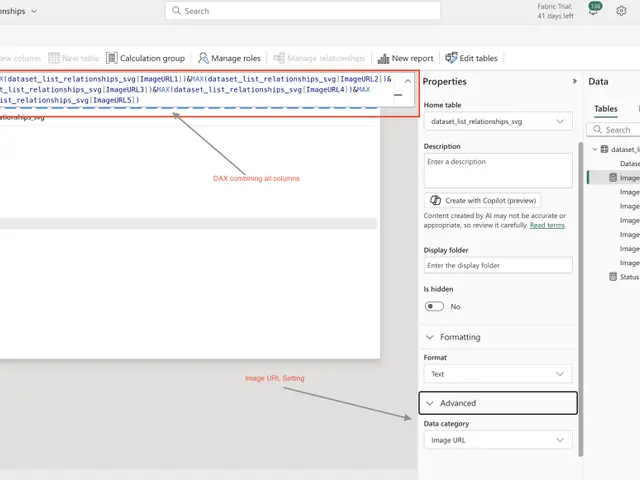 Power BIExploring Relationships in Semantic Models with #SemPy
Understanding the relationships between datasets is crucial in data analytics, especially in the world of self-service BI. Sempy, a Python library unique…
 Microsoft FabricDocument your Microsoft Fabric or Power BI workspaces with Semantic Link Labs
Documentation is a critical and tedious part of every project. However, it is essential to review existing developments or document new…
 Microsoft FabricMarch Madness with conferences
Can you believe how amazing and hectic March has been?! So many community members got to experience some major conferences all…
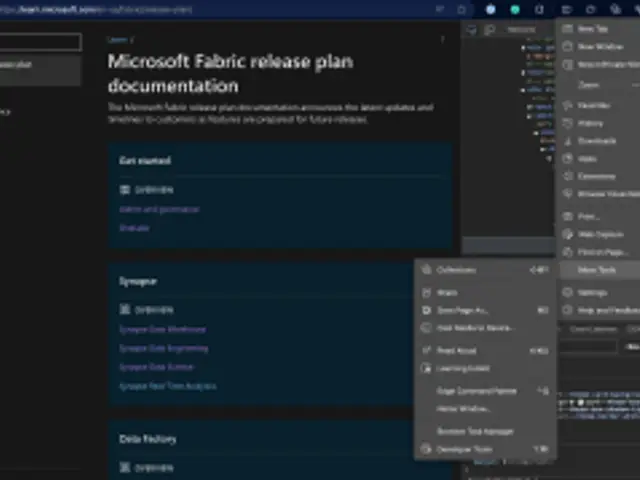 Power BI#MicrosoftFabric Road Map and Web Scraping with Fabric
Scrape the Microsoft Fabric roadmap with a Python notebook, land it in a lakehouse and report on it in Direct Lake, to answer when a feature actually lands.
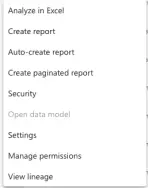 Power BIDocument #PowerBI Workspaces with #MicrosoftFabric #Notebooks
Use a Fabric notebook to get your tenant ID, authenticate to the Power BI REST API, land every workspace you can reach in a lakehouse and report on it.
 Power BIWhat is #MicrosoftFabric and why am I excited about it?
What Microsoft Fabric is, what OneLake and delta parquet change about vendor lock-in, and why the SaaS data fabric announced at Build was worth waiting for.
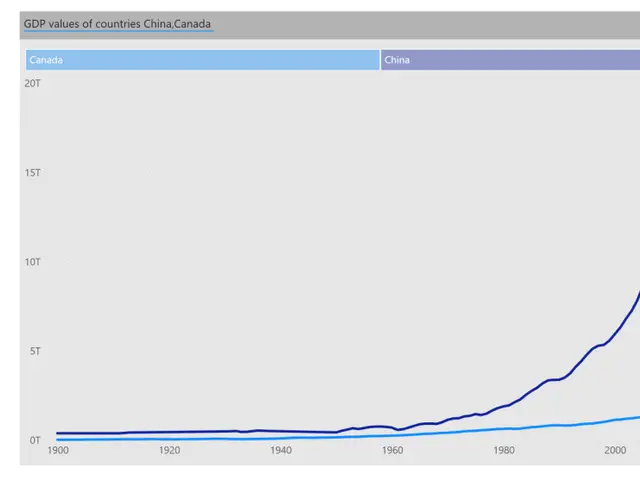 Power BISwitch between a summarized value or selected value with multiple legends
Show an average across every category until a slicer selection is made, then only the selected lines: three ways to do it in Power BI, from layering to DAX.
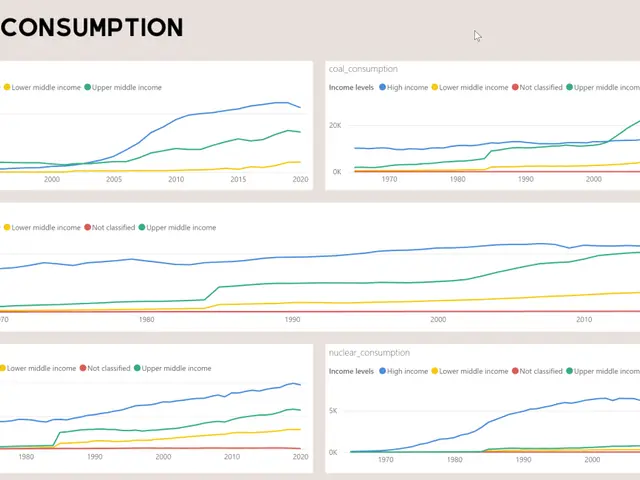 Power BIUsing Tree Map as legend on a page in Power BI
I recently worked on two projects where the client wanted to show multiple metrics sliced by the same categorical data. For…
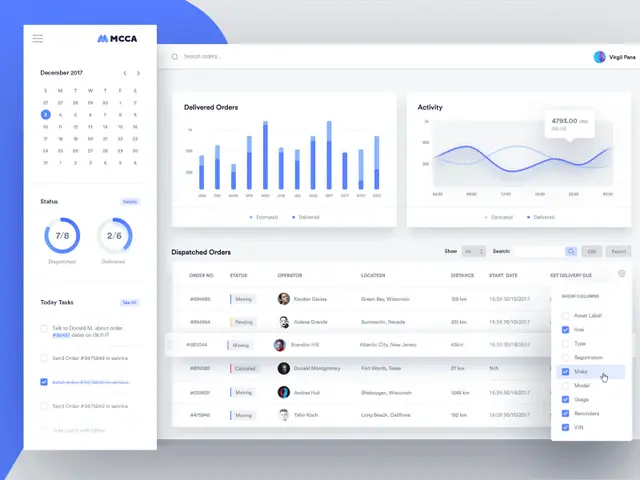 Power BIShowing the number of selected items in a #PowerBI slicer
Tell a reader how many items are selected in a Power BI slicer, with a DAX measure that counts the selection and a shape that displays it beside the slicer.
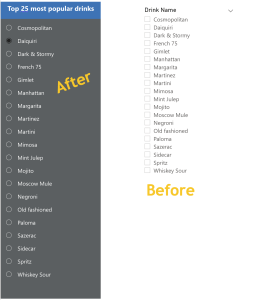 Power BI#Power BI Slicer – Slicer properties to make it look sleeker
Four slicer properties that turn the default Power BI slicer into a sparse one: an item frame, a heavier outline, and an outline colour matched to the page.
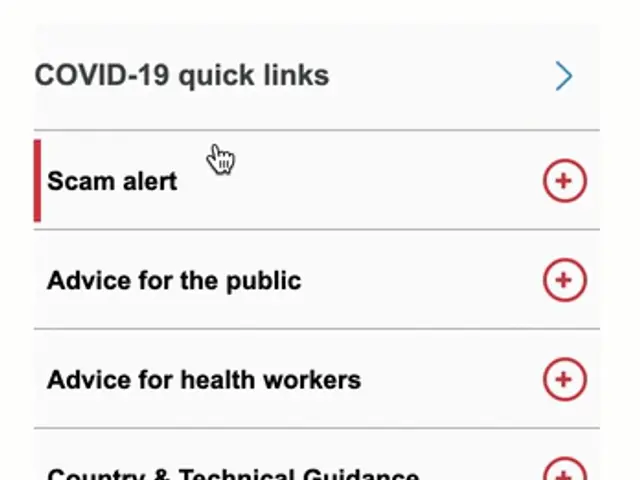 Power BI#PowerBI Buttons with animation
The inspiration behind this post solely came from WHO website https://www.who.int/. I went onto to check some COVID data and found…
 Power BI#PowerBI Bookmarks vs Page Navigation
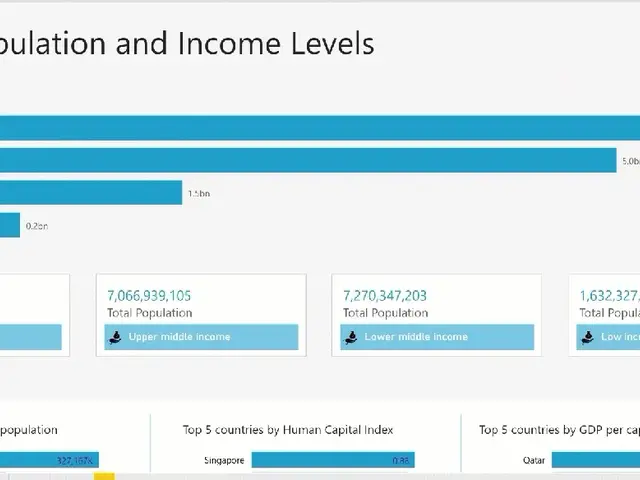
Power BI Bookmarks, the secret behind many sleek reports, It revolutionised the entire PBI Report design approach. Initially, Bookmarks were portrayed…
 Power BI#POWERBI REPORTS LANDING PAGE TIPS AND TRICKS: Progressive disclosure design approach in Power BI using Card pattern
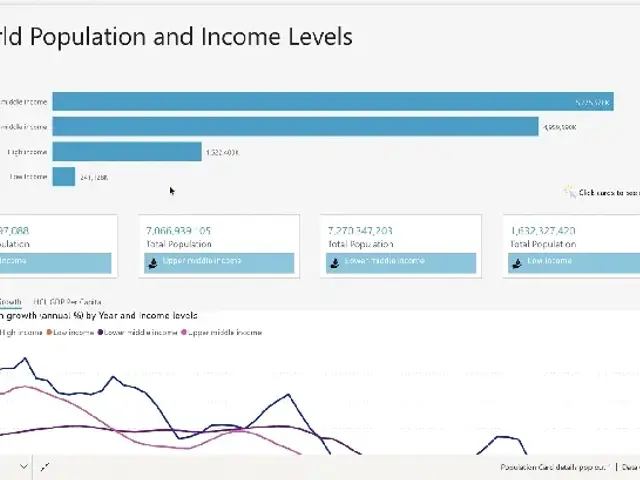
What is Progressive Disclosure? Progressive disclosure is an interaction design pattern that sequences information and actions across several screens (e.g., a…
 Power BIPower BI reports landing page tips and tricks: Tiles using, Images, Power BI buttons, hover effects and all the above
Five ways to build a landing page tile in Power BI, from an image with a bookmark action to transparent buttons whose hover text comes from a DAX expression.
 Power BI#PowerBI Auto Recovery
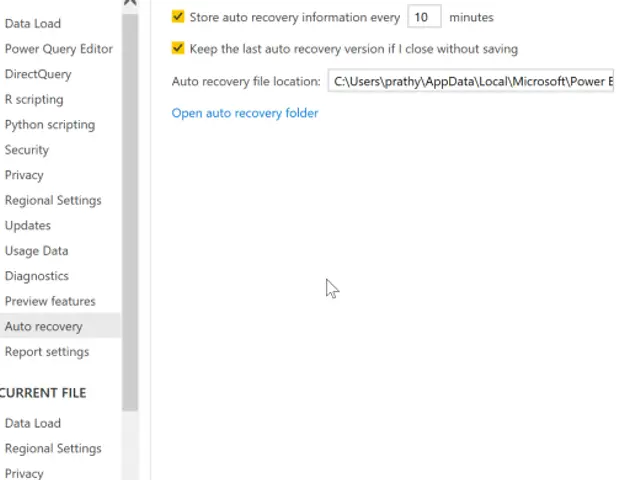
Clicked No, remove the files in Power BI Desktop? The copies are still under Auto Recovery and Temp Saves. Where to look, and when they really do disappear.
 Power BIJan 2020, London #PowerBI UG DataViz
Submissions to the January 2020 London Power BI user group DataViz challenge on the UN Human Development data, and where the group goes from here.
 Power BIHow I designed a layered donut chart
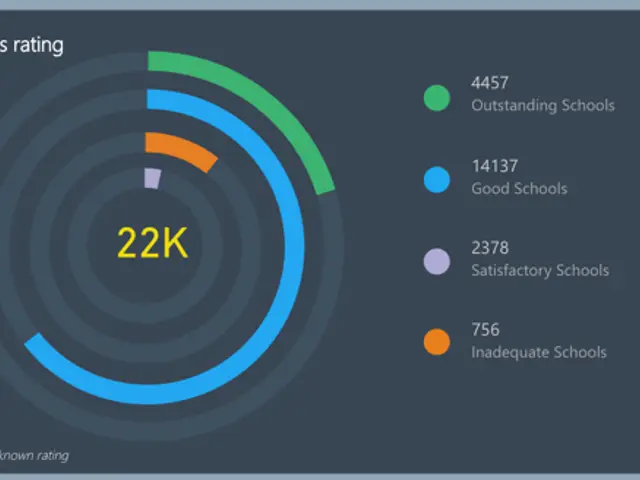
How the layered donut in my UK schools report was built ring by ring, and why comparing Ofsted ratings against the total wanted that shape rather than bars.
 Power BI#DataLounge video with #AltiusData talking about Storytelling and #PowerBI
A few weeks ago I got invited to the DataLounge YouTube series. I went on talking about my favorite topic Storytelling.…
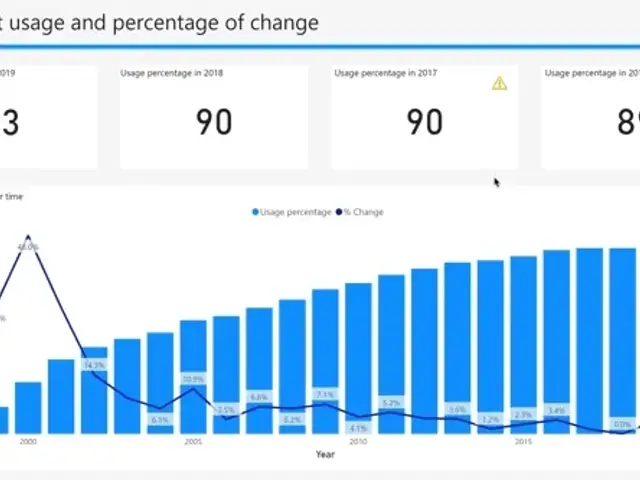 Power BI#PowerBI Card visual to show flags/warnings
Flag only the metrics that need attention on a Power BI card, with a DAX measure for the symbol, conditional formatting for its colour, and a tooltip page.
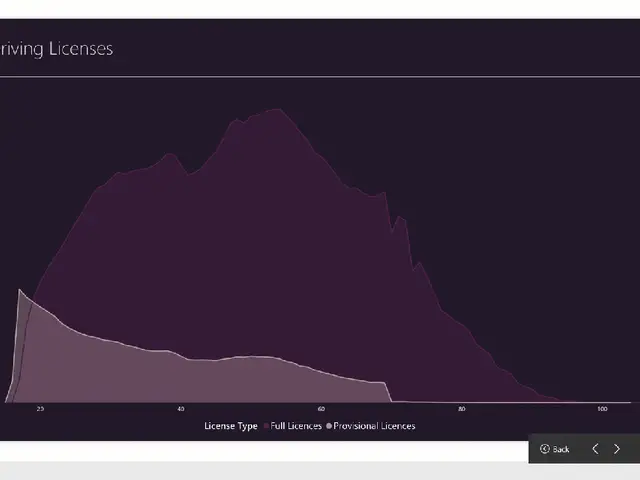 Power BIPower BI visual header tooltip
The visual header tooltip in Power BI, and four things worth putting behind it: annotations, the logic behind a number, how to read the visual, and detail.
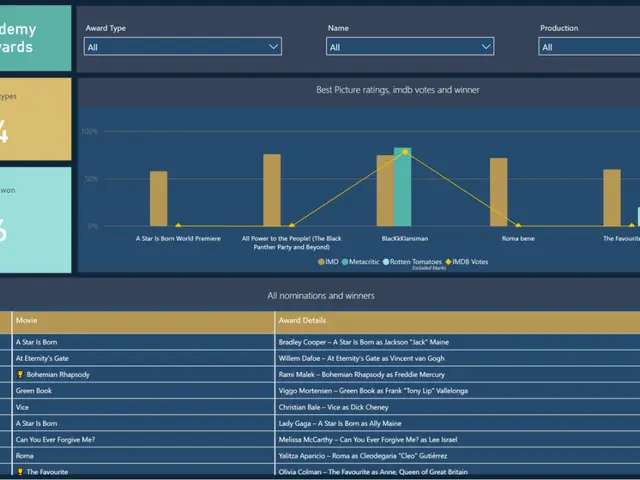 Power BIPower BI Mobile Reporting
Steadily more users are getting interested in Power BI mobile reports, especially when you design reports for executives; they are more…
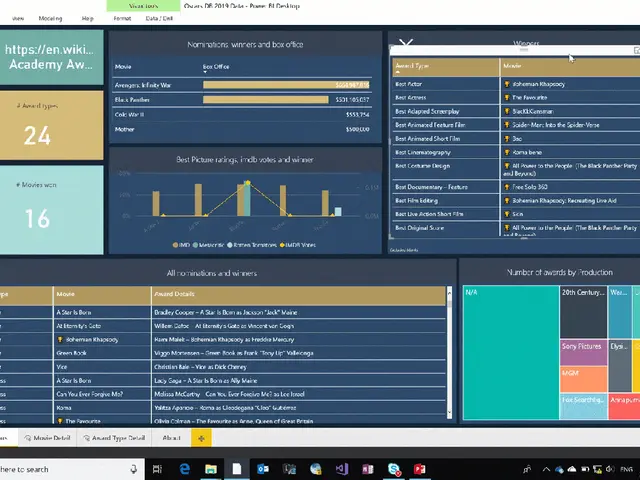 Power BI#PowerBI Focus Mode and Dark Background Images
Focus mode drops your dark background image, so a table with light text disappears. Set the visual background to the same colour and the text survives.
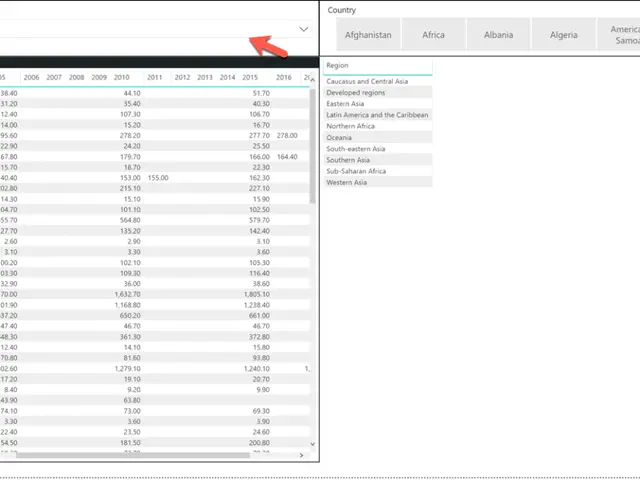 Power BISync Slicers & Sync Slicers Advanced Options
Power BI Bookmarks, Synced Slicers and Selections; these features transformed the way we report using Power BI. Now, most of the…
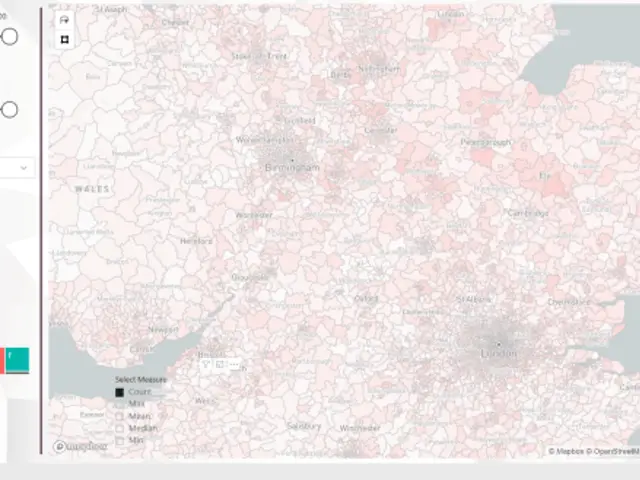 Power BISummary of #LondonPowerBIDataViz December 2018
Four submissions to the December 2018 London Power BI DataViz challenge, each described by the person who built it, and the session that closed the year.
 Power BIVisuals Level Slicers for A Slicer in #PowerBI
Power BI slicers take no visual-level filter, so here is the workaround: a second synced slicer, the selection pane, and visual interactions turned off.
 Power BIDynamic Legend in #Power BI Visual, Line Chart
It has been a while since I written a blog post, even my ten years old daughter started teasing saying “Motionless blog”,…
 Power BIOctober and November #LondonPUGDataViz – UK Price Paid Data
My Power BI journey started with this dataset. Probably one of the most reliable open data source. Nicely formatted and very…
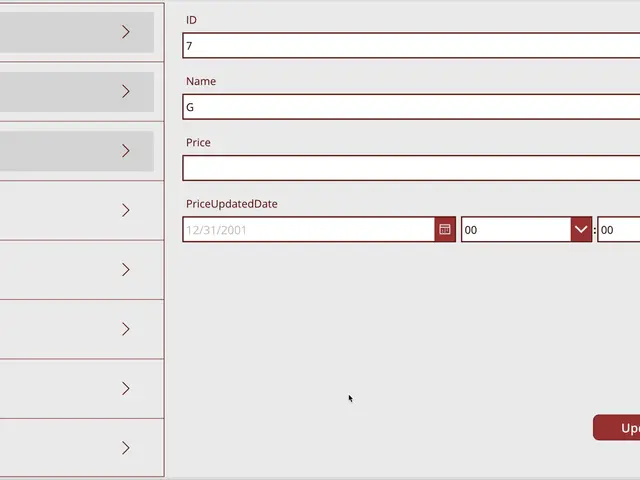 Power BIPowerApps and Sharepoint List-Identify which detail item has already been updated in PowerApps?
Show at a glance which gallery items in a PowerApps app already have comments in the SharePoint list behind it, using a conditional background colour.
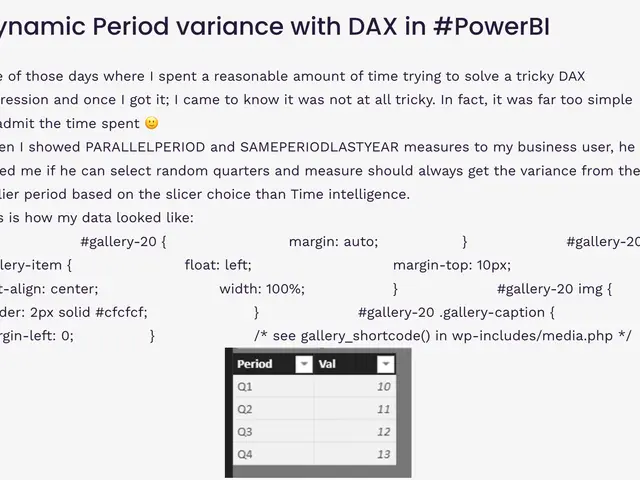
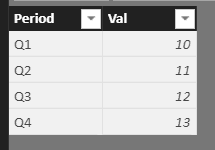 Power BIDynamic Period variance with DAX in #PowerBI
A DAX pattern for variance against the previous selected period rather than the calendar one, so a slicer with random quarters still compares the right two.
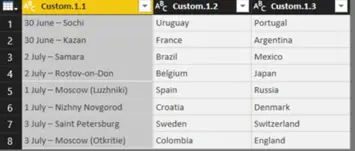 Power BIList.Repeat() in #PowerQuery to duplicate rows
Group every three rows into one with List.Repeat in Power Query: build a base list, repeat each value, add an index and join it back to the original query.
 Power BIMass shooting data
For this month #LondonPUGDataViz, we are going to play with Gun violence archive data. This data is very interesting because it…
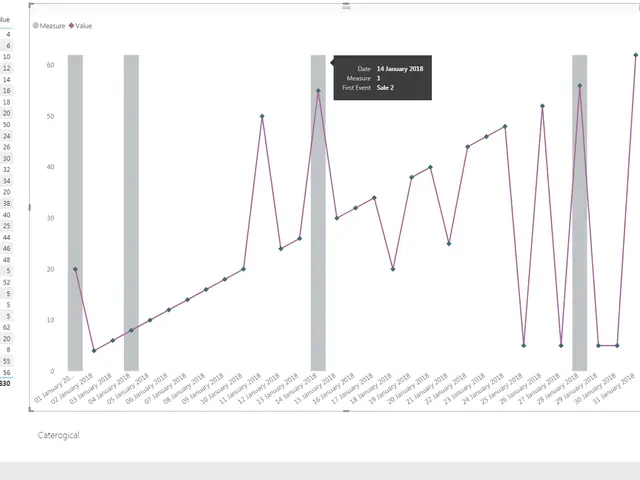 Power BIAdding a vertical line or marker to a chart in Power BI
Power BI has no vertical line in the analytics pane, so here are the workarounds that mark an event on a line chart: a combo chart bar, and markers.
 Power BILondonPUGDataViz -2
The dataset for the next LondonPUGDataViz is The Newyork time bestseller data from Wikipedia. It looks like only data between 2000 to…
- Power BILondonPugDataViz – 1
As some of you already know, we started #LondonPugDataViz at London Power BI User Group for completing two successful years. I am…
- Power BI#LondonPUGDataViz
With inspiration from many DataViz blogs, especially from Story Telling With Data and DataDuo, I thought to start #LondonPUGDataViz. Mainly to…
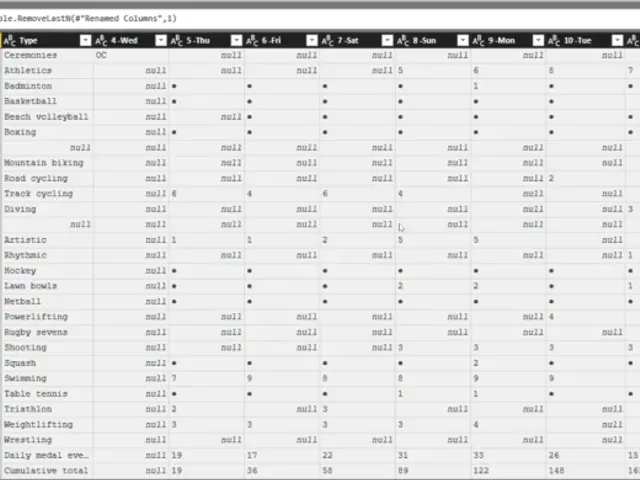 Power QueryReplace all numeric values in multiple columns using #PowerQuery
Learn how to replace all numeric values in multiple Power Query columns at once. A practical M language solution for data transformation in Power BI.
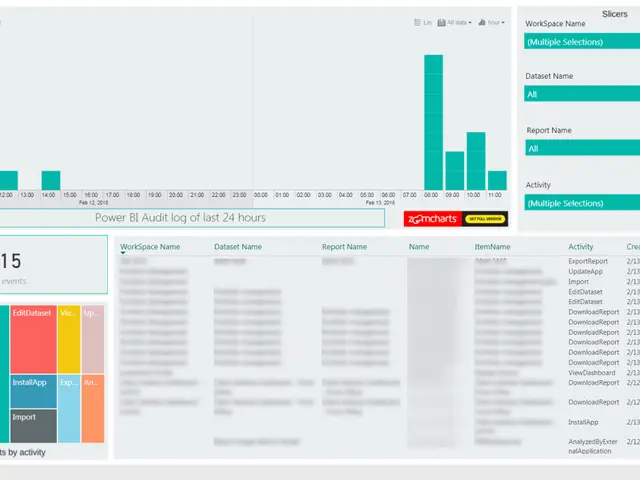 Power BI#PowerBI Audit log using #Office365 Management API
Pull Power BI activity into a model with the Office 365 Management API, so you can answer who is doing what on the tenant and what nobody is using at all.
 Power BIWhere is my Power BI theme file?
The theme file and background images someone imported are still inside the PBIX. Rename it to a zip, open it up, and get the signed-off theme back out.
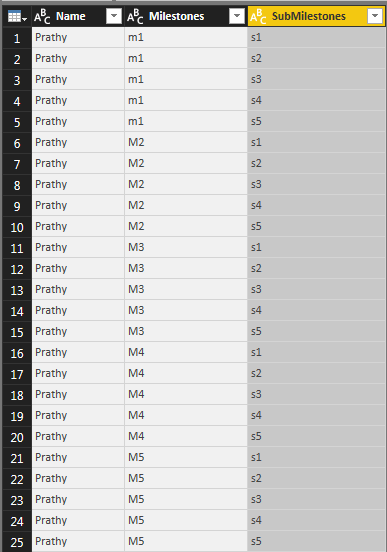 SQLSplit multiple columns into rows in #PowerQuery
Recently, I worked on an interesting problem. Datasource I was working with was a SharePoint list, working with SharePoint lists always…
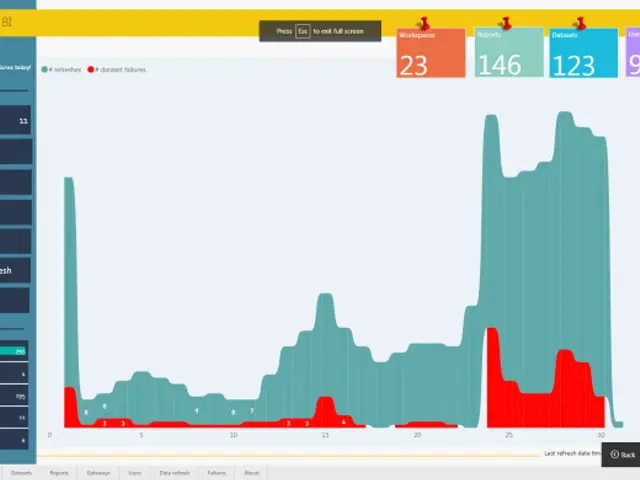 Power BIPower BI Template to document the Power BI Service
Back in September, I promised I would write another blog post with a beautiful looking Power BI template. Even though I…
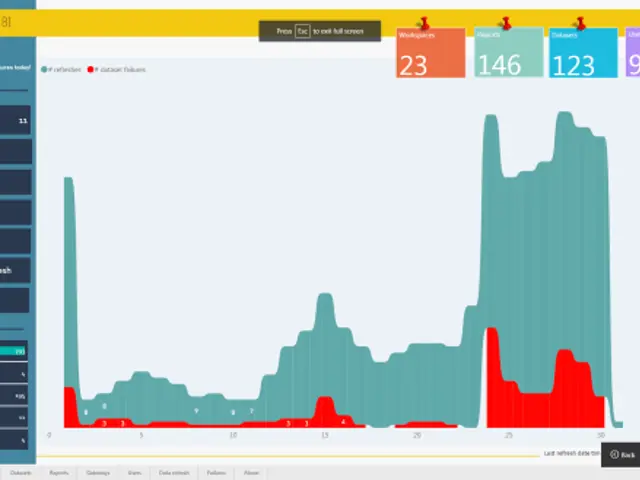 Power BIHow I designed “Power BI Template to document the Power BI Service”
The thinking behind the layout, the colours and the page order of my Power BI Service documentation template: workspaces, then datasets, then gateways.
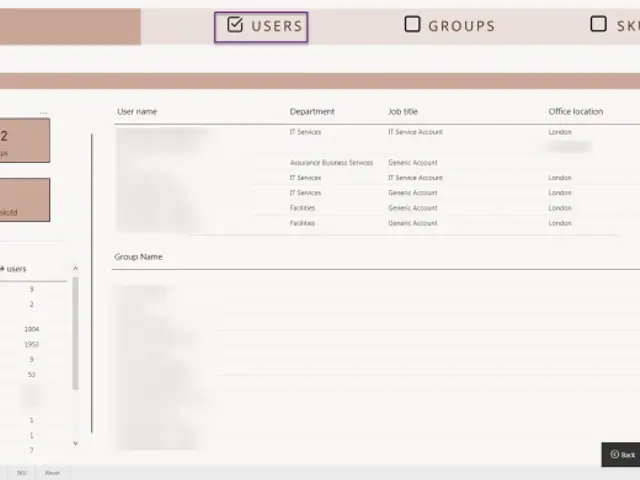 Power BIHow to find all Power BI users in an organisation?
Answer who has access to what in Power BI by pulling users, groups and licence SKUs from the Graph API into one model, with the template to start from.
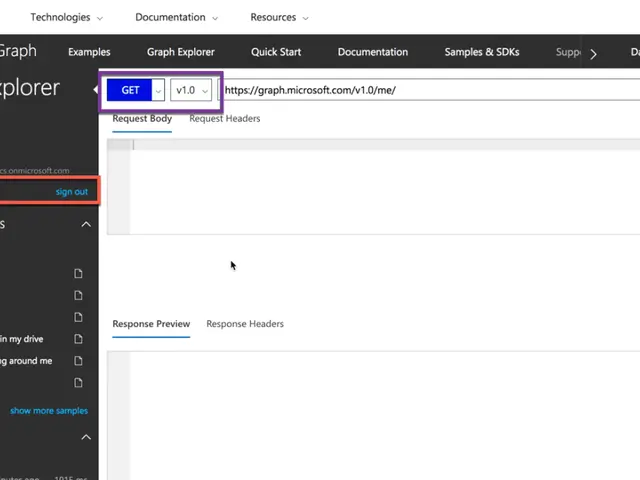 REST APIAccess Microsoft Graph API using Power BI
Recently I came across Microsoft Graph API through Power BI Custom data connectors documentation. Amazed by the amount of information provided…
 Power BISharePoint List Power BI Template
SharePoint is a killer; front end looks nice and beautiful. Once you start exploring behind the screens, that is when it…
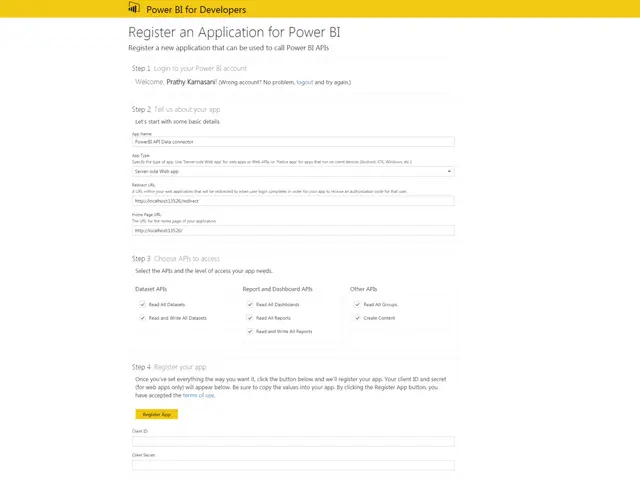 Power BICalling Power BI API using Power BI Desktop to document Power BI Service
Document a Power BI tenant from Power BI Desktop alone: get an OAuth token in M, then list every workspace, dataset and report with a Power Query function.
- Power BIDynamically update Offset value for API calls using Power BI / Power Query
Page past an API's row limit in Power Query: generate the offset values as a list, call the endpoint for each one and expand the results into one table.
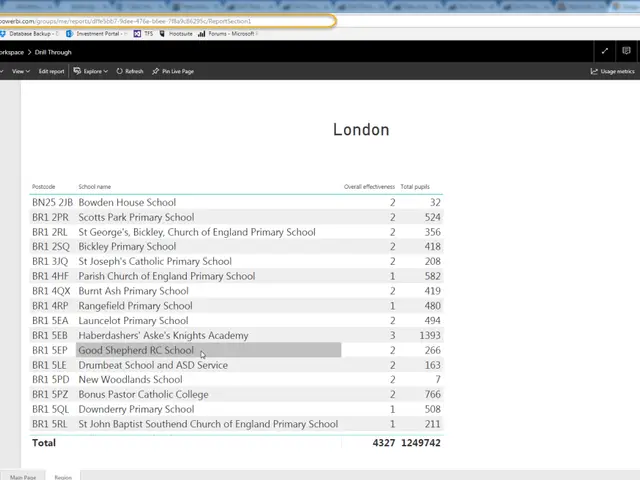 Power BIPower BI Workaround – Drill Through Reporting in Power BI
Drill through between Power BI reports before it was a feature, by building the target report's URL from query string filters, query parameters and apps.
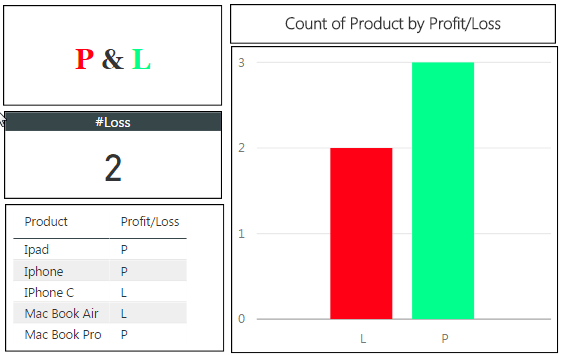 Power BIPower BI Workarounds – Clickable Card / Card Look-alike
Power BI has no clickable card, so here is a look-alike that shows the same number and cross-filters the rest of the page when a user clicks on it.
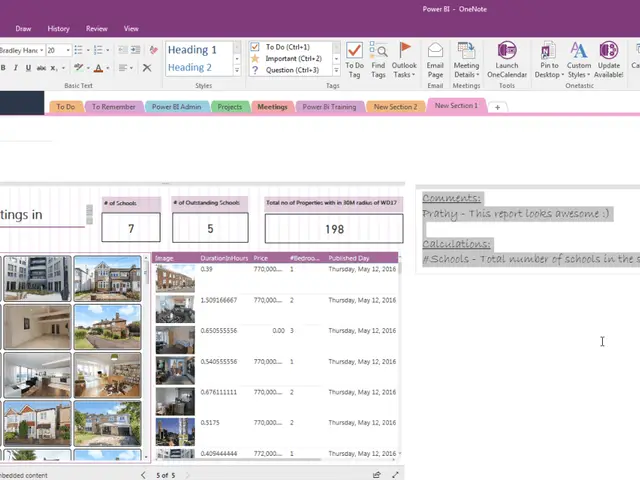 Power BIPowerBI Embedded with OneNote
Power BI reports can be embedded in a OneNote page by pasting the embed URL, and refresh in place. The catch is that only publish-to-web reports will work.
 Power BIPASS BA Marathon – Compelling Visuals in Power BI
Three formatting tricks from my PASS BA Marathon session: measure-driven GIFs, a background that changes with the data, and Unicode characters as icons.
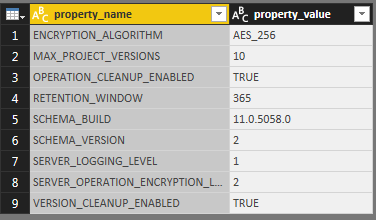 Power BIModify Column Names Using Power Query M Functions
Update – There is already a dedicated function available to do this, Table.TransformColumnNames. Thanks Imke Feldmann for the shutout. You can…
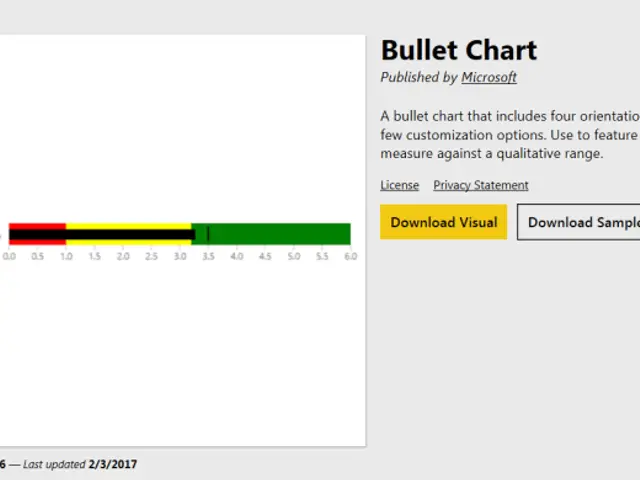 Power BIHighlight a Specific Data Point using Power BI
Highlight one bar in a Power BI chart the way Stephen Few does it, using a DAX measure rather than waiting for a formatting option that does not exist yet.
 Power BIUK Power BI Summit – 2017
Notes and pictures from the UK Power BI Summit at Hemel Hempstead in February 2017, organised by Jen Stirrup, where I helped out and spoke on visuals.
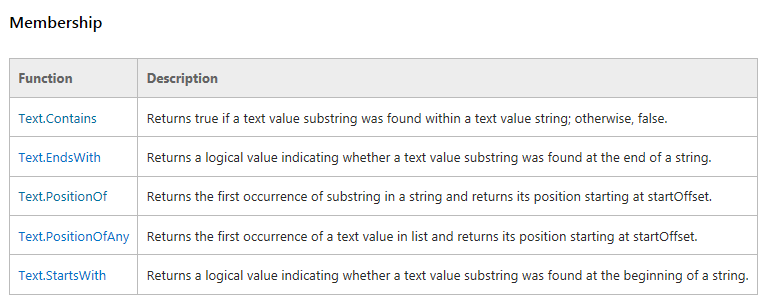 Power BIFind level of Directories / Find String in Power BI
Directories at different levels are critical for some organisations. One of the requirements I received recently was to import Flat Files from directories (…
 SQLValidating Data using SSIS
Validate flat files as they arrive with SSIS, so bad rows are accepted or rejected at the first step instead of being chased through the rest of the ETL.
 Power BIData story – Property search with Power BI
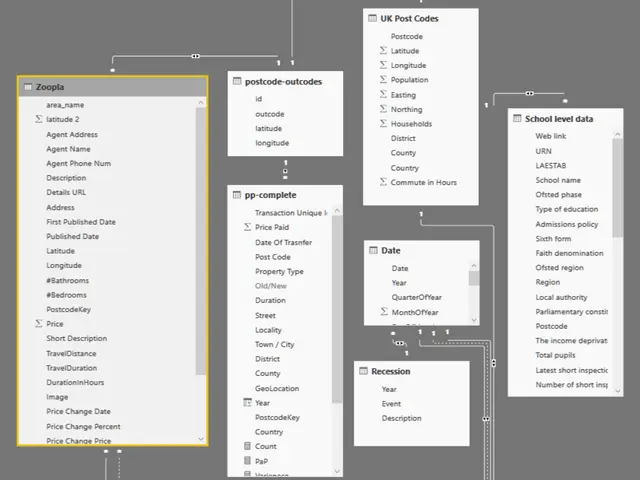
How the property search data story was built: Ofsted, Land Registry price paid, Zoopla listings and Bing Maps commute times joined into one Power BI model.
 Power BIDimensional Modelling Workbook
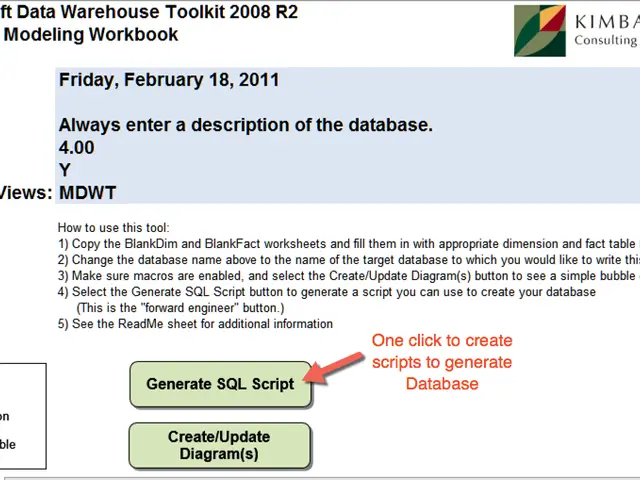
A few years ago when I was searching for a free dimensional modelling tool, through some forum; I saw this fantastic Dimensional…
 SQLI am a Microsoft Data Platform MVP :)
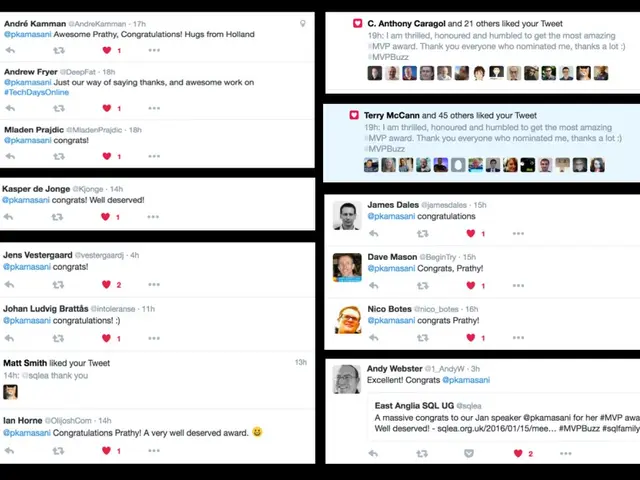
Becoming a Microsoft Data Platform MVP in October 2016, and the family, the guilt and the community behind it. A thank-you note rather than a how-to.
 Power BIHow to add extra columns to an existing Power BI file which has CSV as data source
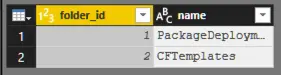
A refresh will not pick up a new CSV column, because Csv.Document pins the count. Change the Columns number in the advanced editor and the column appears.
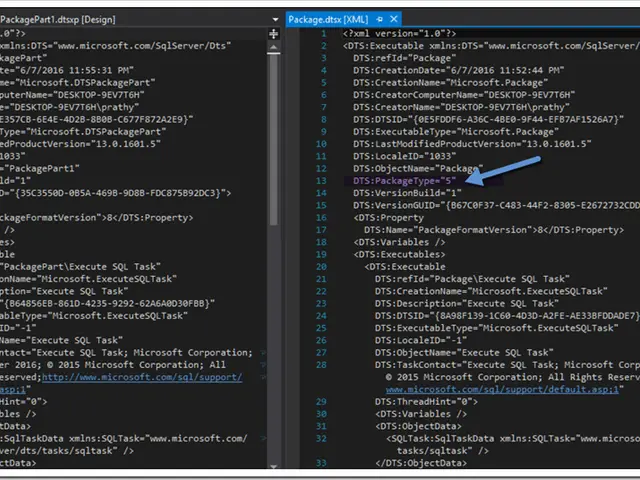 SQLMY THOUGHTS ON SSIS 2016 – SSIS PACKAGE PARTS-2
This is the second part of SSIS Package Parts blog post, I would recommend you to read other part first! In the previous…
 Power BIMy Thoughts On SSIS 2016: SSIS Control Flow Package Parts -1
An introduction to SSIS 2016 control flow package parts: what they are, how to create one, and why the feature drew more criticism than praise at release.
 Semantic LinkMy Thoughts On SSIS 2016
What is genuinely new in SSIS 2016, starting with the return of incremental package deployment and what SSISDB actually records when you deploy one package.
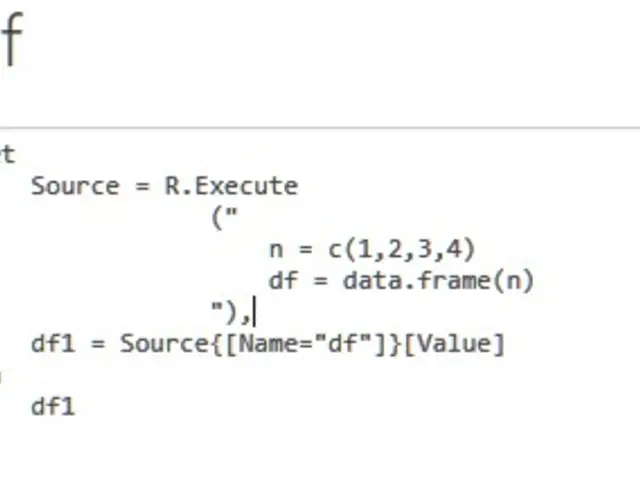 Power BIDownload And Unzip files using Power BI Desktop and R Script
Most of the open data source providers supply data in a compressed format, especially when files are large. That is what…
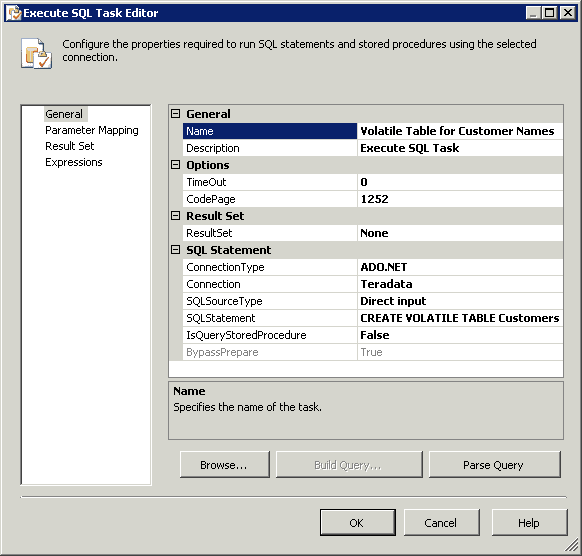 SQLWorking With Teradata Volatile Tables And ADO.Net Connection
Create Teradata volatile tables from SSIS with query banding and RetainSameConnection, then use the ADO.NET result set as a source in a data flow task.
 SQLTwitter Analysis using SSIS 2016 and SQL Server R Services
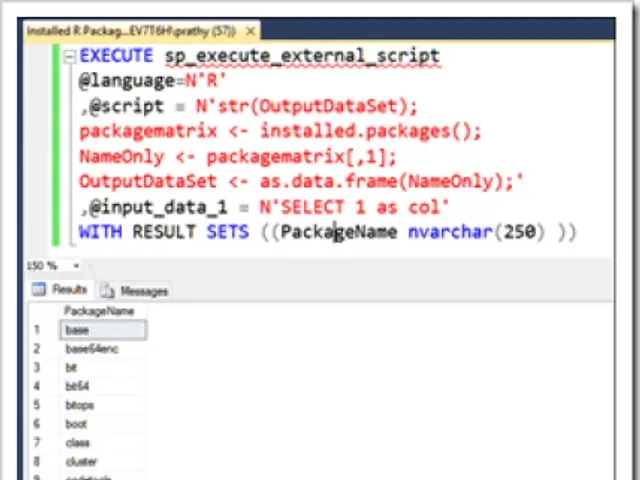
Pull tweets with an R script running in SQL Server R Services, work out the data types it returns, and load them into SQL Server with an SSIS 2016 package.
Every post keeps the URL it was published at. Posts moved over from the previous site keep their original dates.