Work
Power BI portfolio
Power BI reports on open data
If I put aside my childhood dream of becoming a pilot, most of my other ambitions have had a creative angle. I have always wanted a portfolio of my work, and these are my Power BI reports on open data. They are where I try ideas out: scrolling layouts, app-like navigation, palettes borrowed from somewhere unexpected. I hope one of them gives someone an idea.
Every report opens in Power BI in a new tab. They were built between 2018 and 2024, so some show their age, and I have left the notes I wrote at the time.
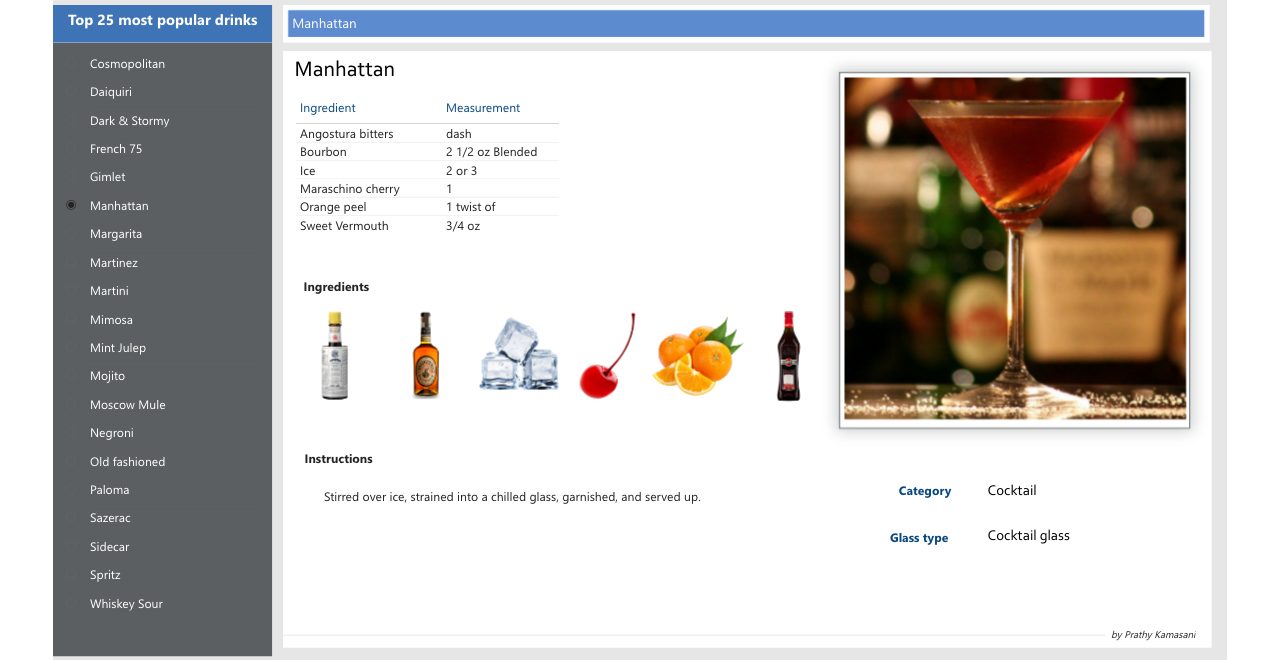
Top 25 popular cocktails
A list of the 25 most popular cocktails and what goes into them.
I treat each design like my baby, and this one is my favourite. I made it in 2020 or 2021 and, looking back from 2024, it was a good report for its time. I might pick different colours today.
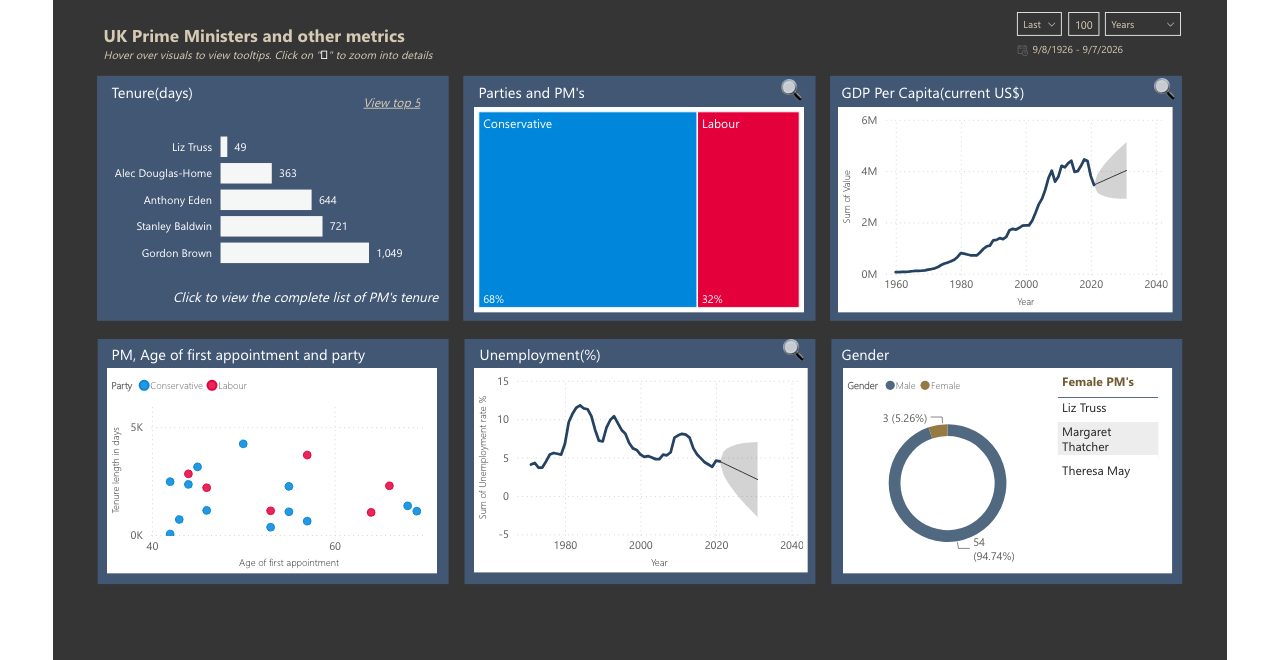
UK prime ministers and their metrics
Tenure and background data on every UK prime minister, collected from public sources.
I usually like a straightforward star schema, and this model became more complicated than I prefer, but it works. The design came first here: I found a layout I liked and then gathered the data points to fill it. For colour I used the two parties' own colours, because most people already know them, and a softer palette around them so the data points stand out.

BBC 100 Women 2021
The BBC's 2021 list of 100 influential women, scraped from the BBC website.
The whole report is built around the feeling of being a little girl who saw an article in the newspaper and kept a journal of clippings. You flip through it. The data is web-scraped and the backgrounds are made in Canva. The click-next behaviour uses Power Apps, so it does not show in the published version.
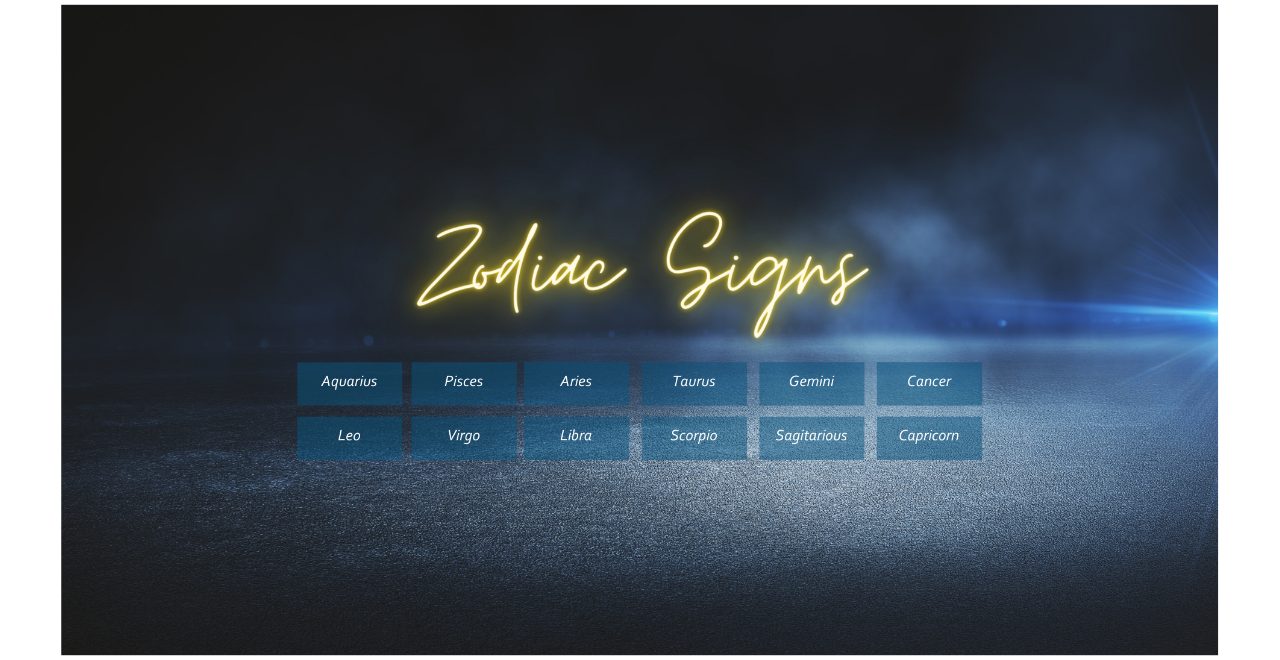
Zodiac signs
Web-scraped descriptions of the twelve star signs.
I love anything to do with stars and the cosmos, so when I wanted to build an app-like report I used star signs instead of random data. It is the pattern for when users just want to view one item with a little useful information around it. Power BI's UX tooling was less mature when I built it, which made it a good challenge.
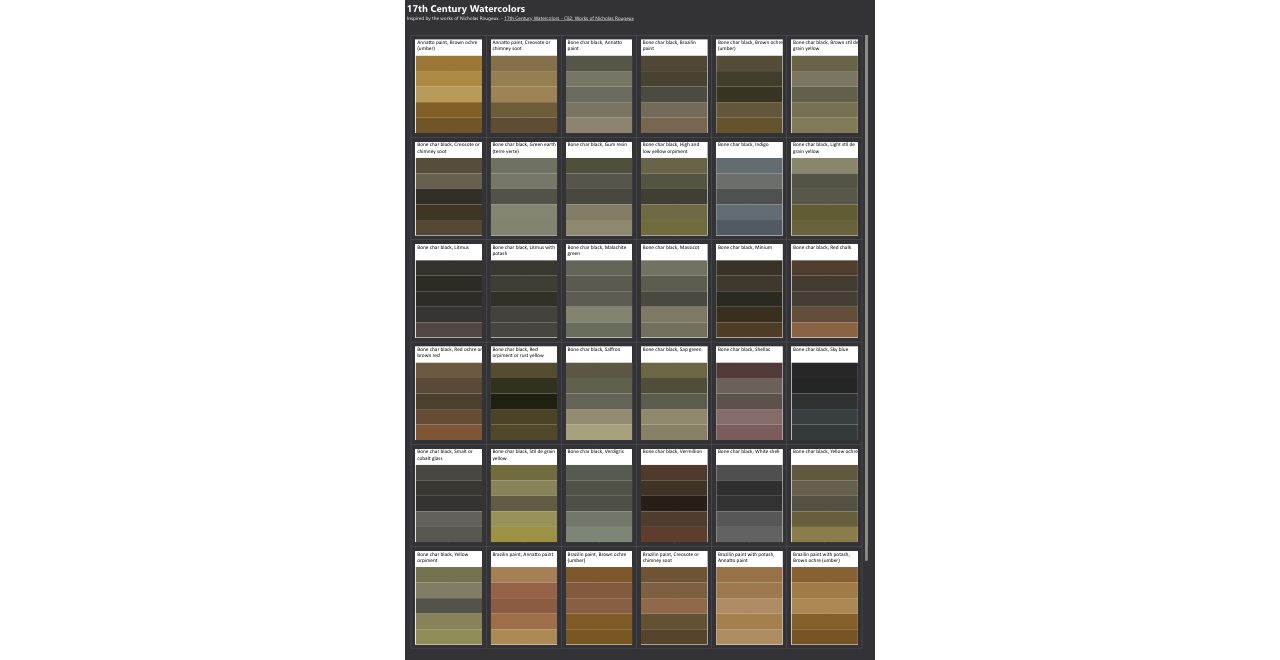
17th century watercolours
Colour names and values from a 1692 book of watercolour mixtures, published as open data by c82.net.
The challenge was getting a similar result in Power BI. With more time there is a lot you could do with this palette, but I went for a simple bar chart. Sometimes simplicity is better than complicating things. One table, no relationships.
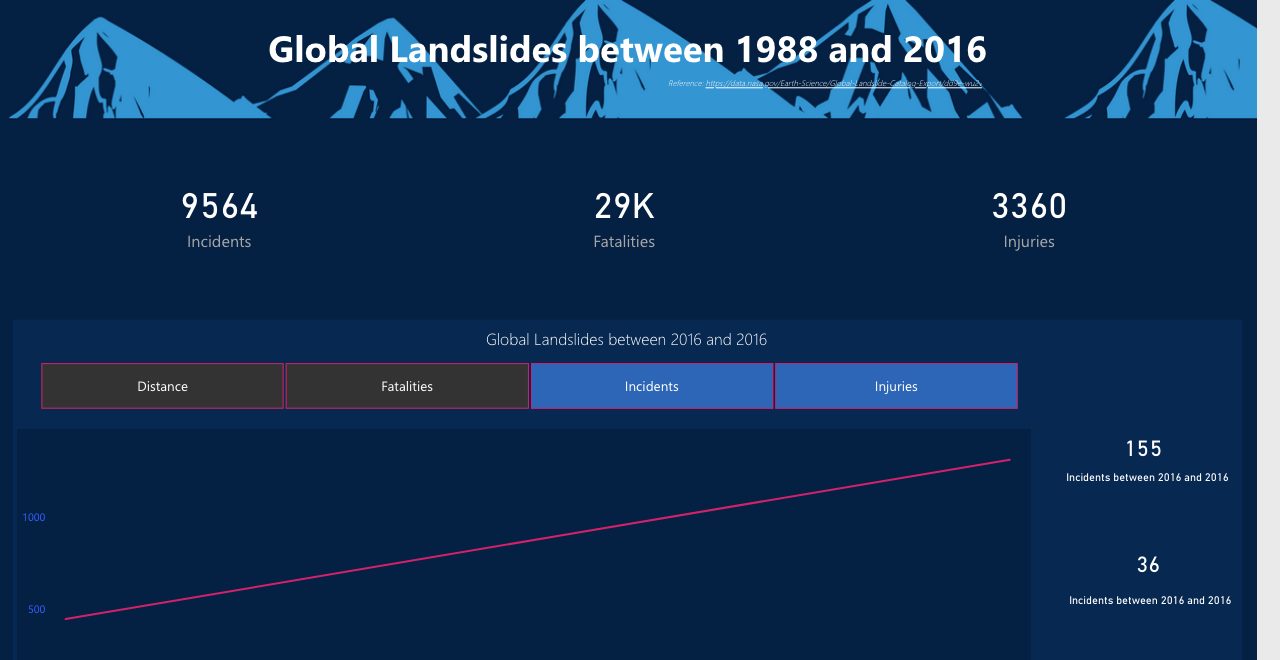
Global landslides
NASA's global landslide catalogue.
Everyone scrolls now, so I designed this one vertically. Stephen Few says not to exceed a single screen; I ignored that on purpose, but kept to a recommended infographic size so it is not a very long scroll. Everything is on one page.
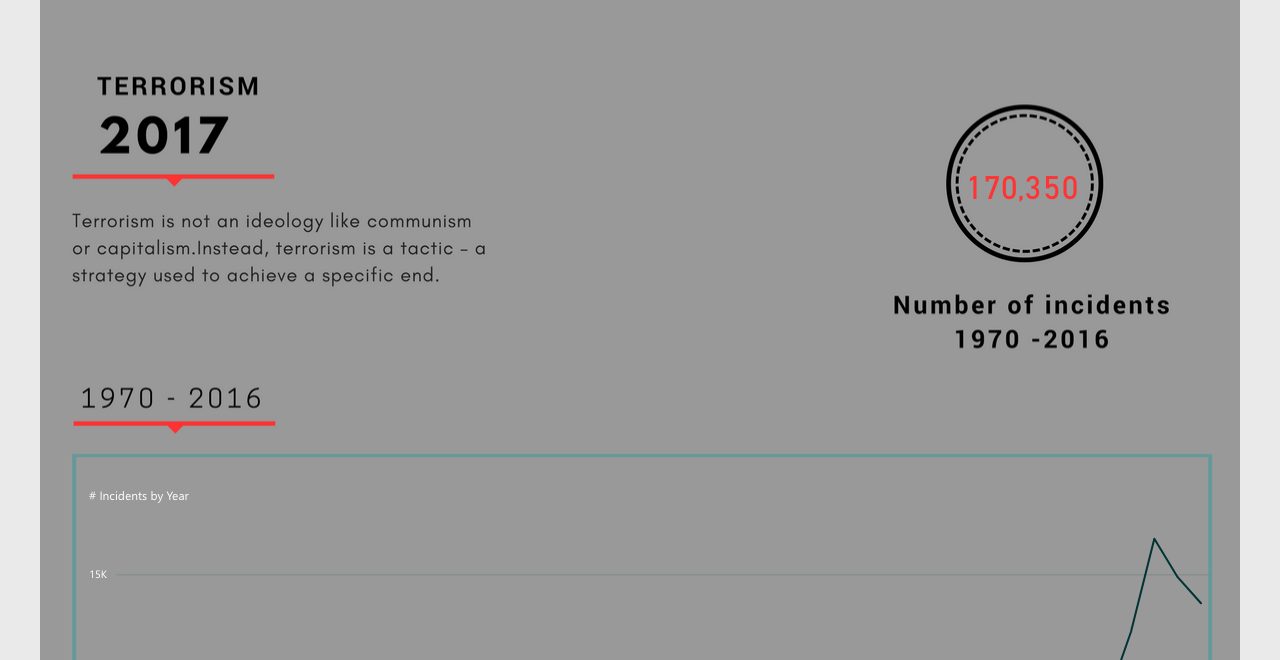
Terrorism in 2017
Incidents from the Global Terrorism Database and Wikipedia.
Made in January 2018. Terrorism is a sensitive topic and I do not think these datasets are reliable, so do not read the figures as facts. The point was the design: custom visuals, bookmarks and narration in the background, and a scrollable page to show that a Power BI report does not have to fit the traditional report dimensions.
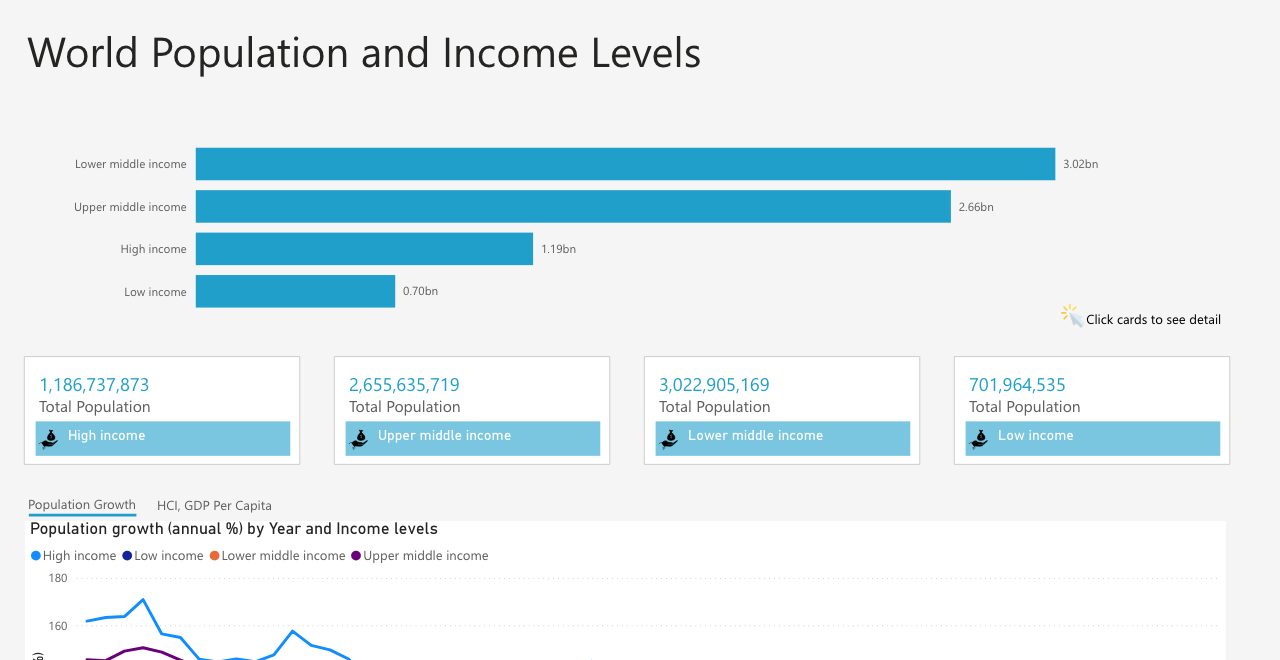
World population and income levels
World Bank population and income group data by country.
A landing page built on progressive disclosure: show a little, let people choose where to go next.
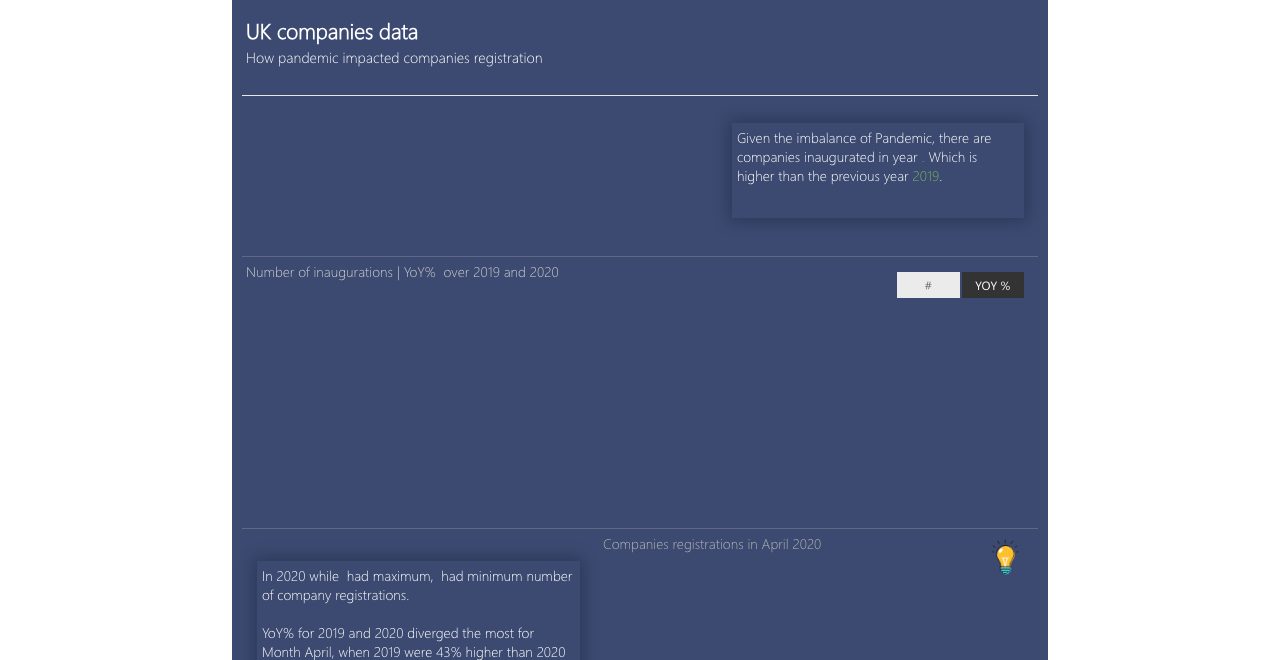
UK Companies House data
Companies House's free monthly snapshot of live companies: type, registered office, nature of business, status and key filing dates.
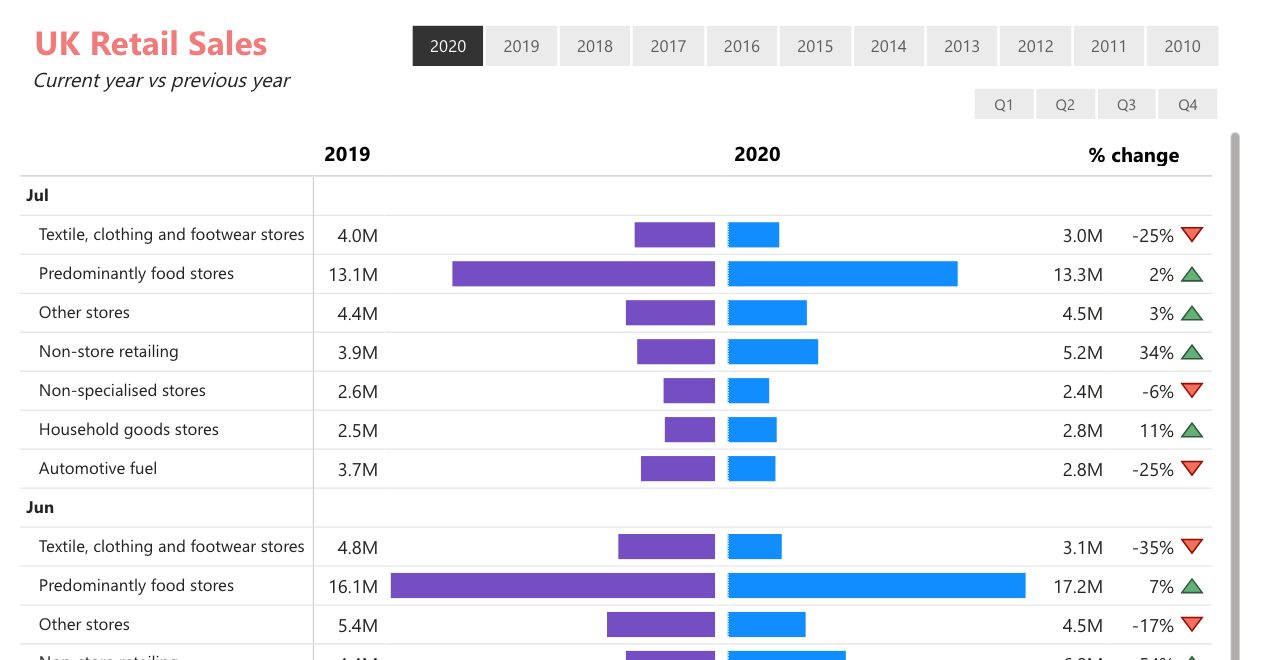
UK retail sales, current year versus previous year
Office for National Statistics retail sales figures.
The goal was a clean current-year against prior-year comparison. The model design is walked through in my first YouTube video, bad sound and all.
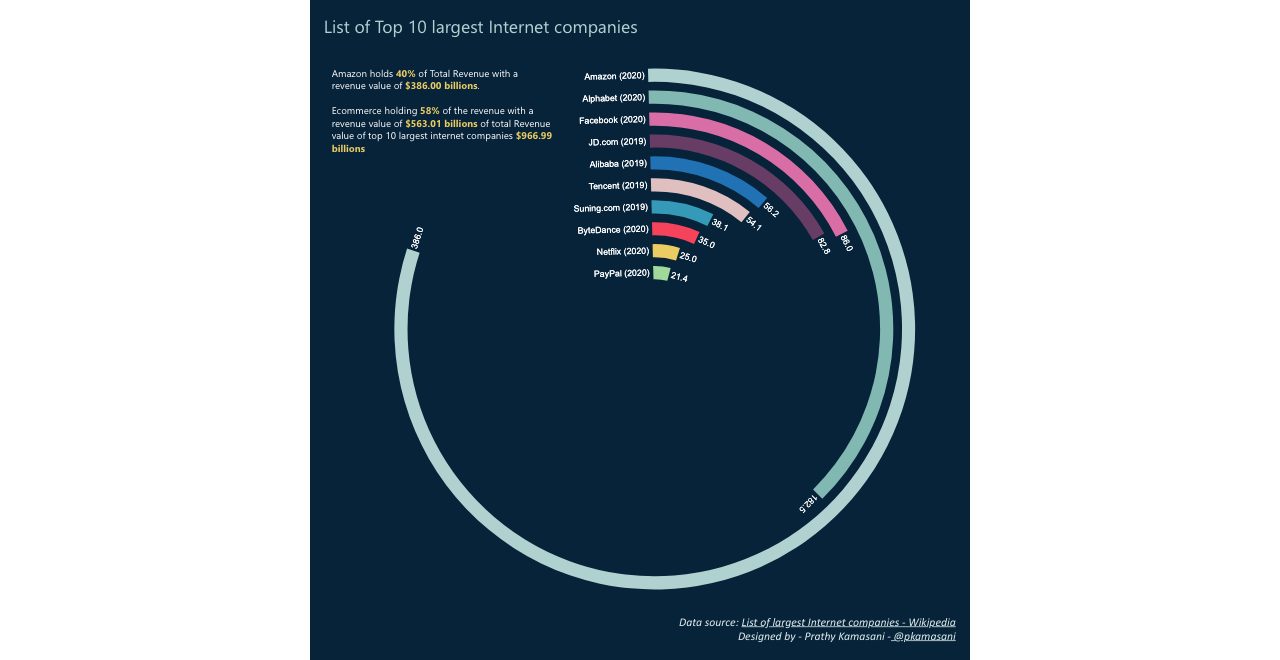
The ten largest internet companies
Revenue and headcount for the ten largest internet companies, from Wikipedia.
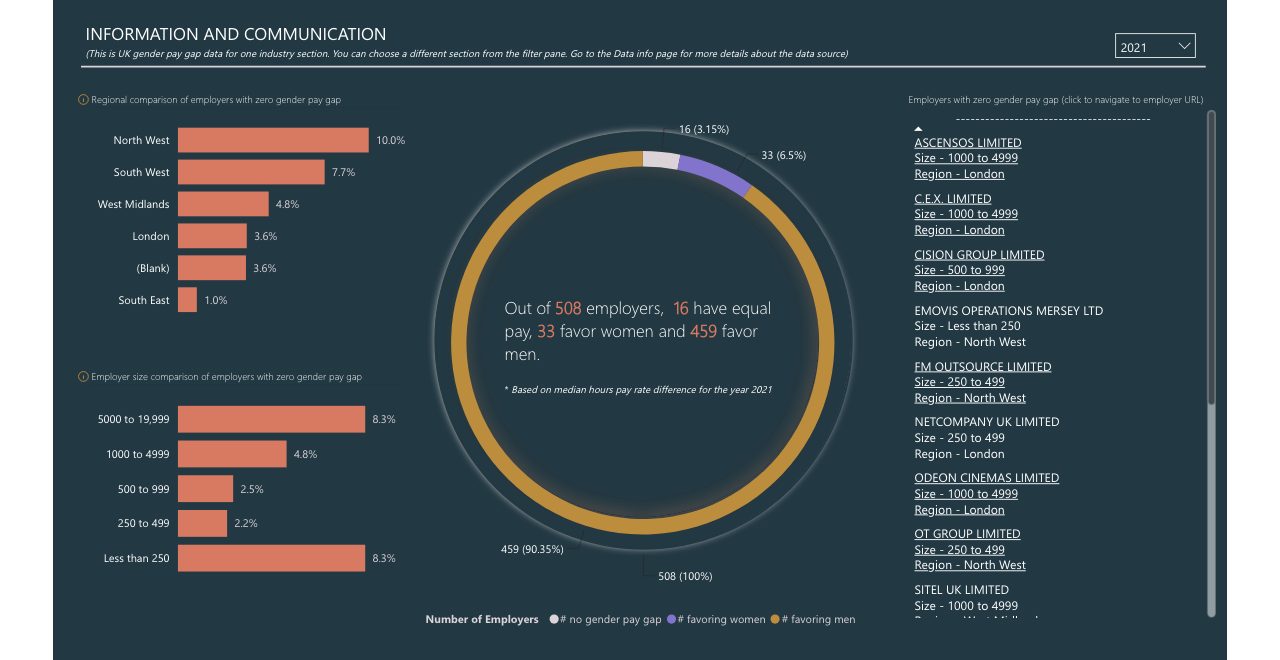
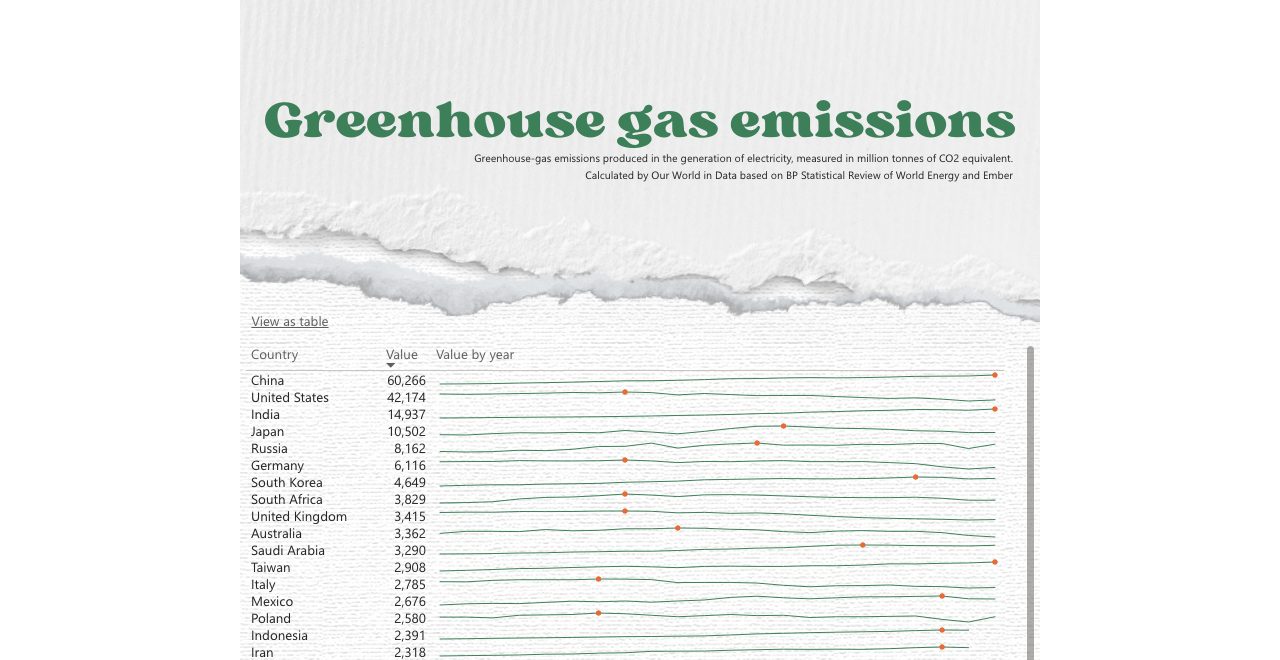
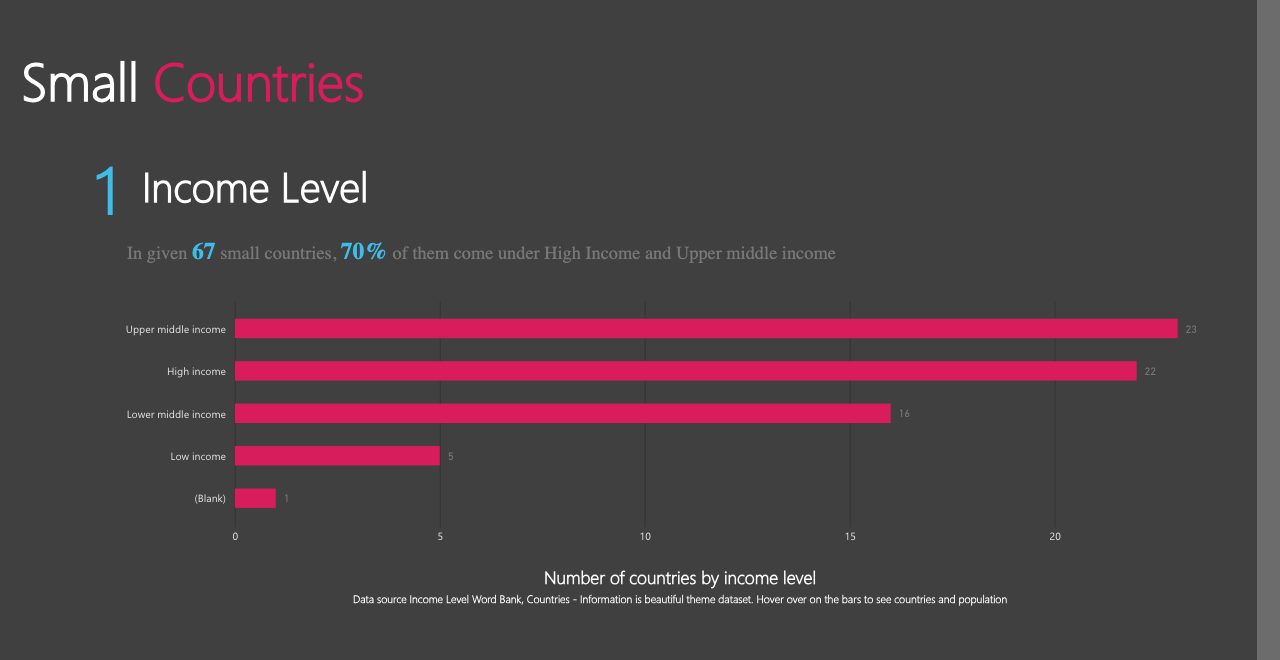
Scrollable report
A report laid out to scroll like a web page rather than fit one screen.
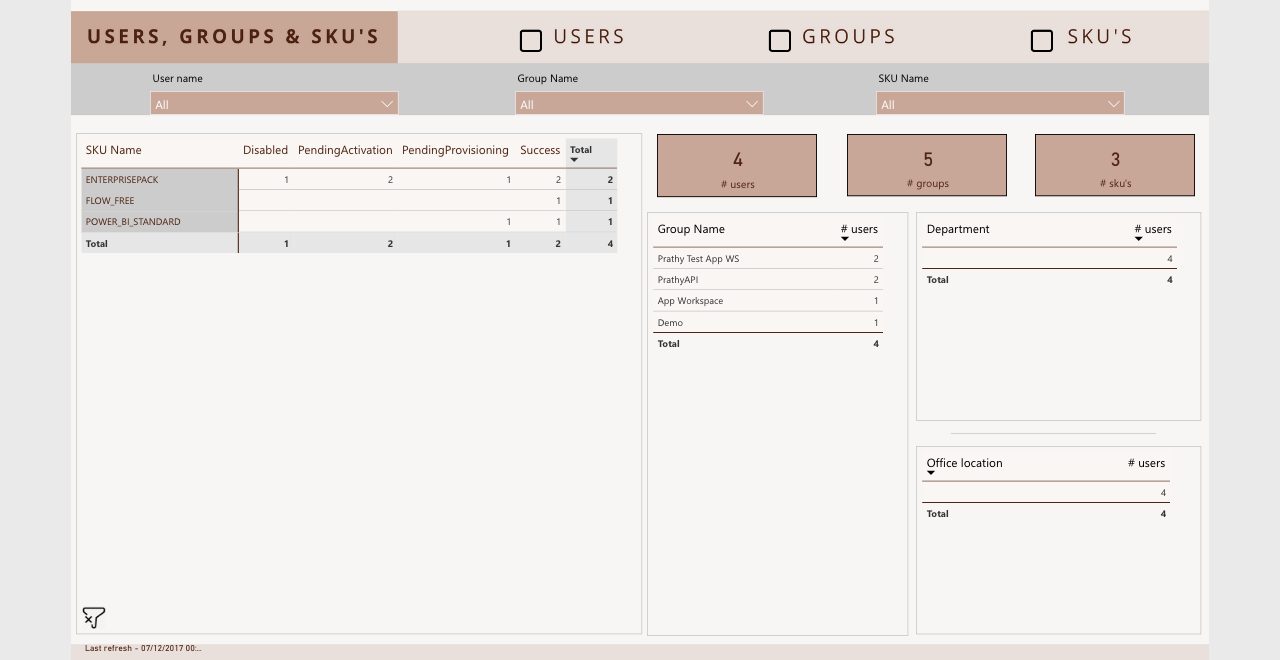
Power BI users in an organisation
Power BI activity data, from my 2017 post on finding every Power BI user in a tenant.
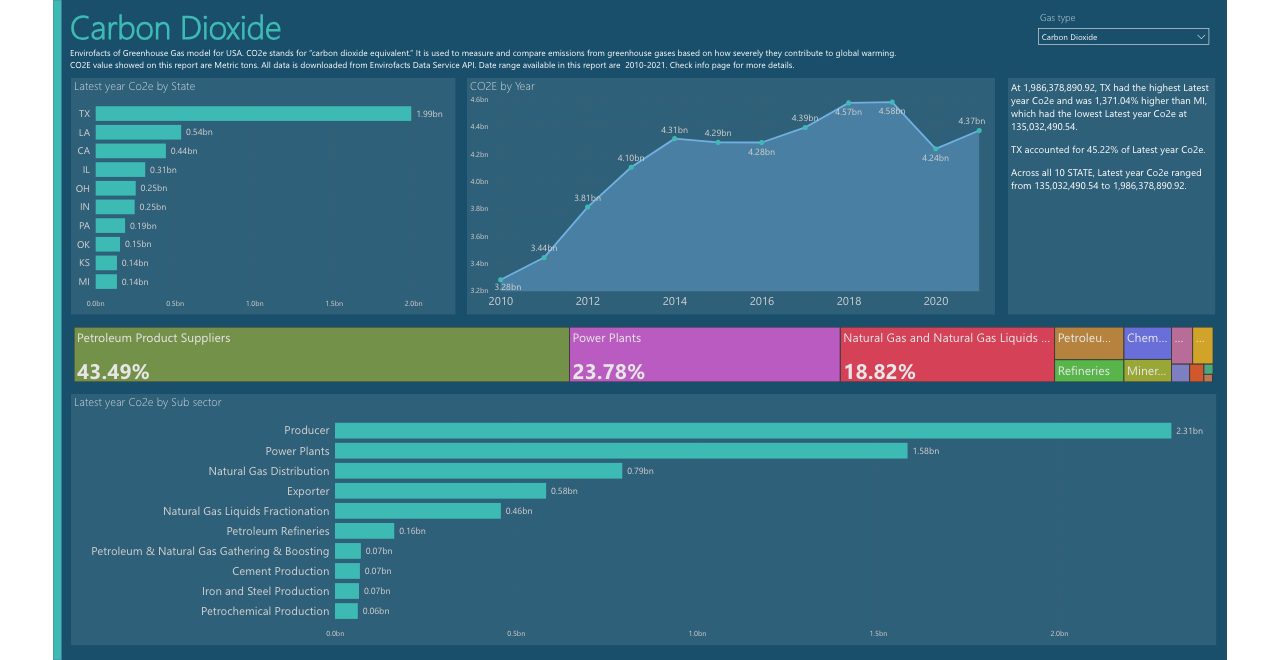
US Envirofacts
Open data from the US Environmental Protection Agency's Envirofacts service.
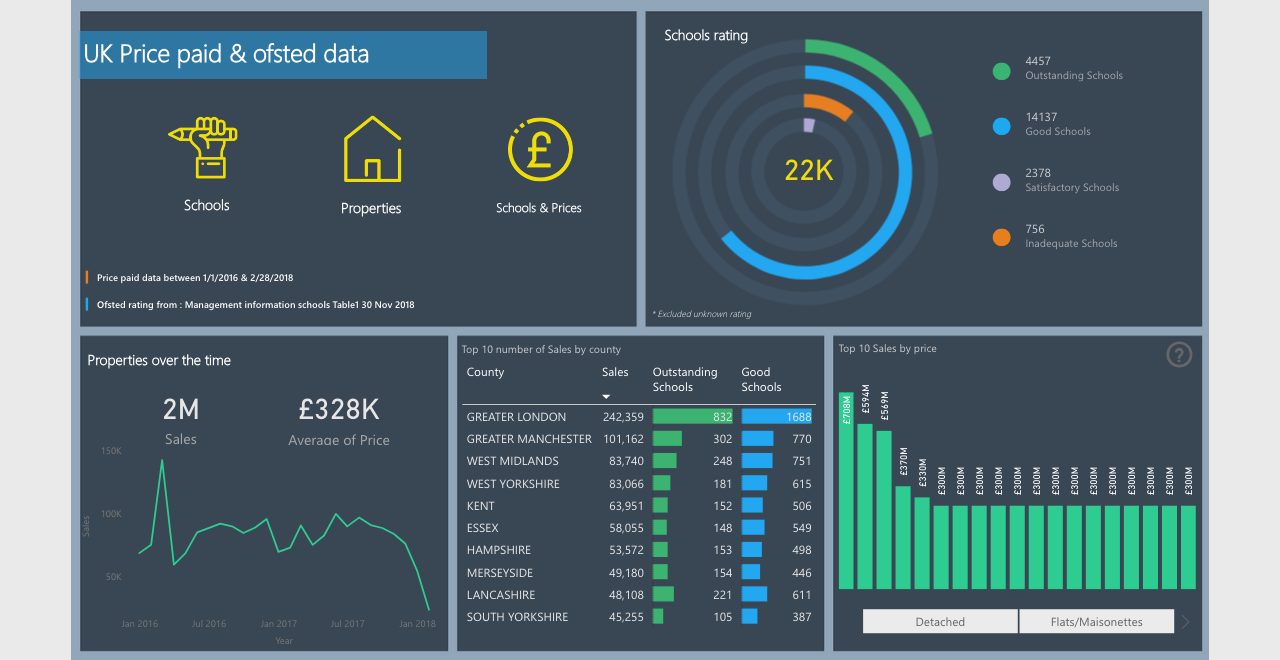
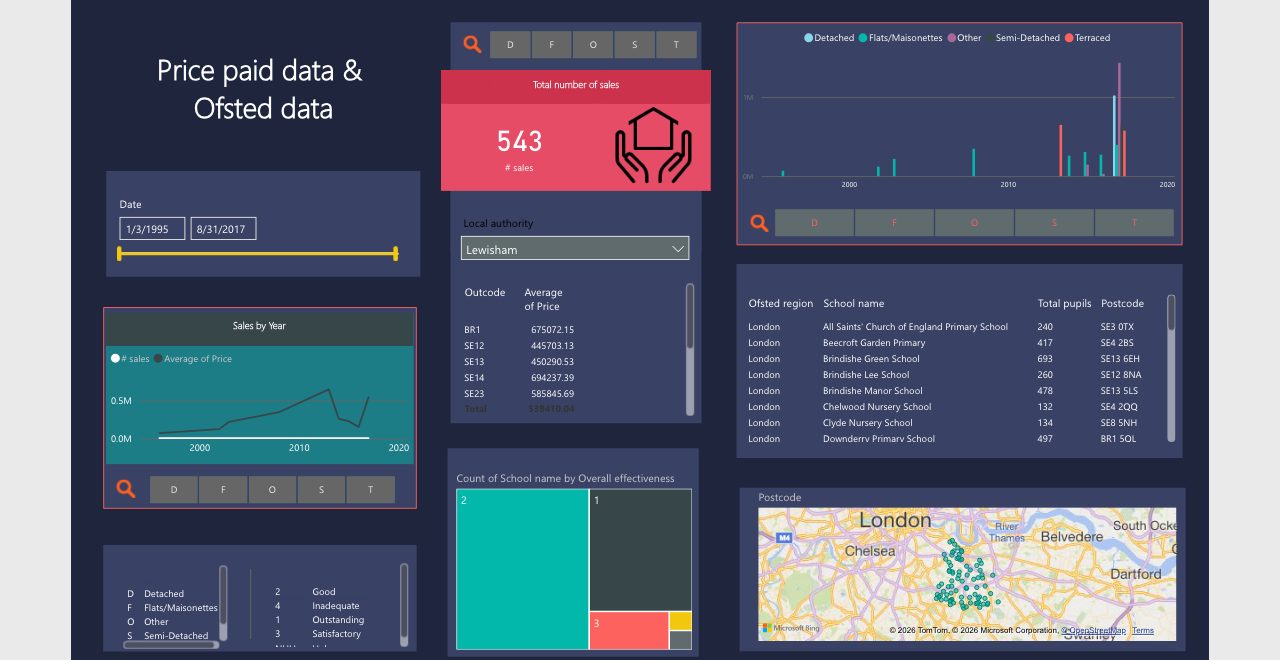
UK price paid data and Ofsted data
HM Land Registry price paid data alongside Ofsted school inspection data.
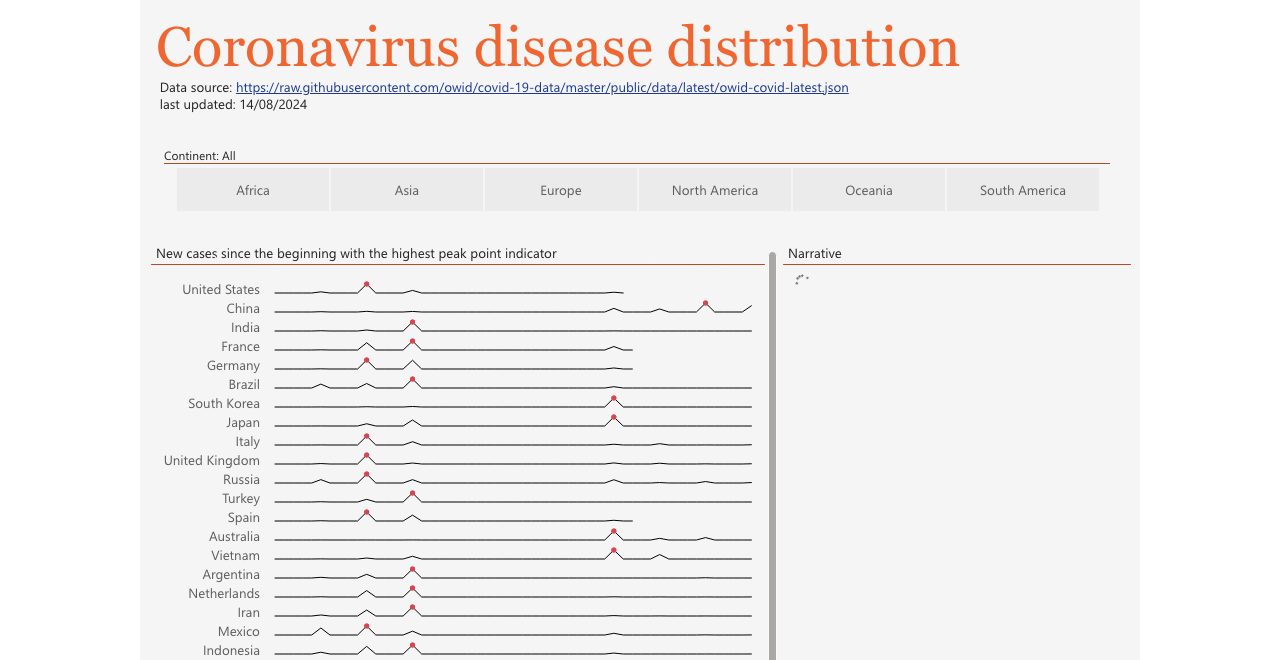
Coronavirus disease distribution
Open data on the geographic distribution of coronavirus cases.

The design and storytelling side of Power BI
You have reports that don't answer questions, don't help anyone make a decision, and have no user flow. Start there.