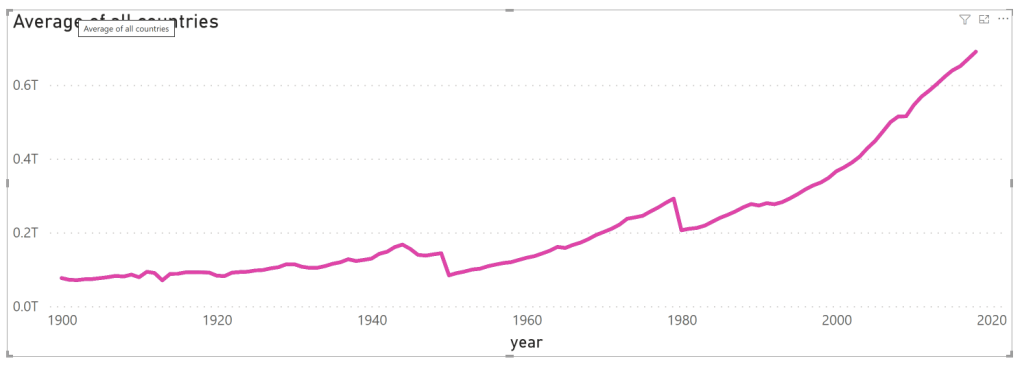
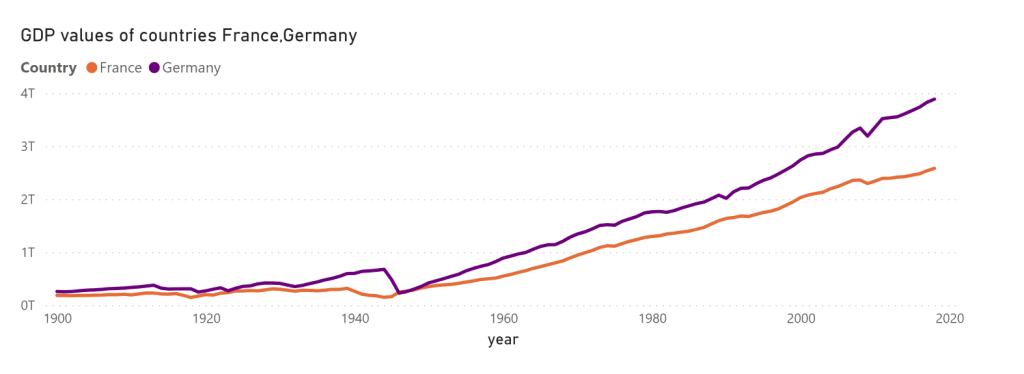
A colleague of mine came to me with an interesting use case, “ Switch between a summarized value or selected value with multiple legends”. For example, I have five countries and their GDP values. When the end user goes to the report, the user would like to see the average GDP of all countries, but when the user selects single or multiple countries on the slicers, the line chart should show only selected values. Like below:
There are multiple ways to achieve this; some are more elegant than others.
Layering visuals
First, I create two DAX measures to show values based on selection.
All avg =
VAR V1 = CALCULATE(COUNTROWS(VALUES('Table'[Country])),ALLSELECTED('Table'[Country]))
VAR V2 = CALCULATE(COUNTROWS(VALUES('Table'[Country])),ALL('Table'[Country]))Returnif(v1=V2,CALCULATE(AVERAGE('owid-energy-data'[Value]),ALL('Table'[Country])))
selected avg =
VAR V1 = CALCULATE(COUNTROWS(VALUES('Table'[Country])),ALLSELECTED('Table'[Country]))
VAR V2 = CALCULATE(COUNTROWS(VALUES('Table'[Country])),ALL('Table'[Country]))Returnif(v1=V2,BLANK(),AVERAGE('owid-energy-data'[Value]))
Then I create two line charts, using the year on the X-axis and one of these measures on the Y-axis. Enable Legend on Visual, where I’m using the “selected avg” measure.
Create two other measures for Titles:
Title All =
VAR V1 = CALCULATE(COUNTROWS(VALUES('Table'[Country])),ALLSELECTED('Table'[Country]))
VAR V2 = CALCULATE(COUNTROWS(VALUES('Table'[Country])),ALL('Table'[Country]))Returnif(v1=V2,"Average of all countries")Title Selected =
VAR V1 = CALCULATE(COUNTROWS(VALUES('Table'[Country])),ALLSELECTED('Table'[Country]))
VAR V2 = CALCULATE(COUNTROWS(VALUES('Table'[Country])),ALL('Table'[Country]))Returnif(v1<>V2,"showing selected average")
Update respective visuals titles with conditional formatting
Make a few more changes, like disabling Axis titles and making more line charts of the same size. Here I haven’t updated Min and max axis, but sometimes that needs to be addressed based on data.
Then I get below viz. It nicely shows, Average value by default, and when the user chooses a country, it shows the selected country value.
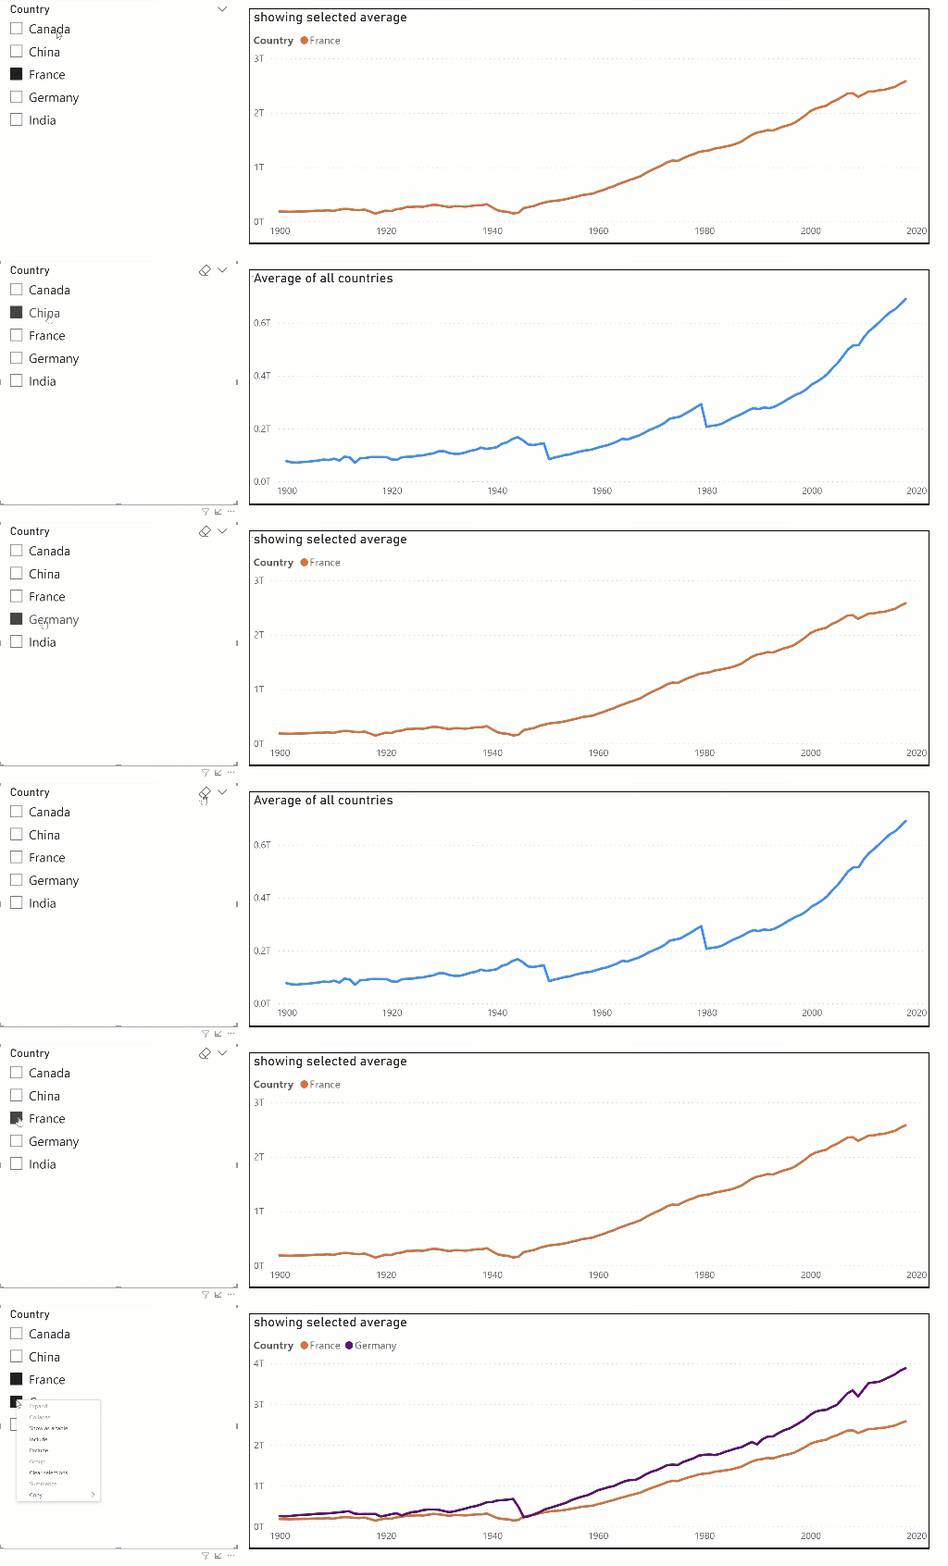
One main issue with this approach is I can only see tooltips of the top visual. The same goes for all other “More options” of the visual.
Using a single measure
Another approach is to, instead of layering, use one measure to switch between average and selected values.
I create a new measure
Dynamic Avg =
VAR V1 = CALCULATE(COUNTROWS(VALUES('Table'[Country])),ALLSELECTED('Table'[Country]))
VAR V2 = CALCULATE(COUNTROWS(VALUES('Table'[Country])),ALL('Table'[Country]))Returnif(v1=V2,[All avg],[selected avg])
Also, create a new Title measure
Title =
VAR V1 = CALCULATE(COUNTROWS(VALUES('Table'[Country])),ALLSELECTED('Table'[Country]))
VAR V2 = CALCULATE(COUNTROWS(VALUES('Table'[Country])),ALL('Table'[Country]))
VAR SelctedCountries = CONCATENATEX(VALUES('Table'[Country]),[Country],",")Returnif(v1=V2,"Average of all countries", IF(COUNTROWS(values('Table'[Country]))=1, "GDP value of "& SelctedCountries&" ","GDP values of countries "& SelctedCountries&" "))
This enables the end user to view the average as the default and select value based on slicer selection.
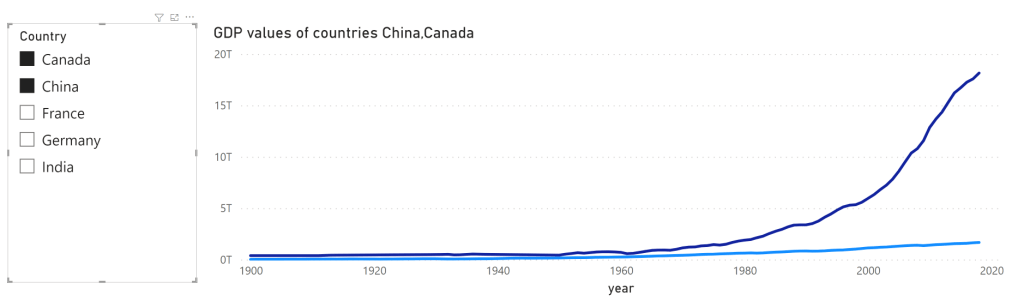
But for User Experience, we need a legend to show what slicer has been selected, and things change as soon as we enable legend. Legend is enabled even when the average is displayed, and it causes confusion for the end user.
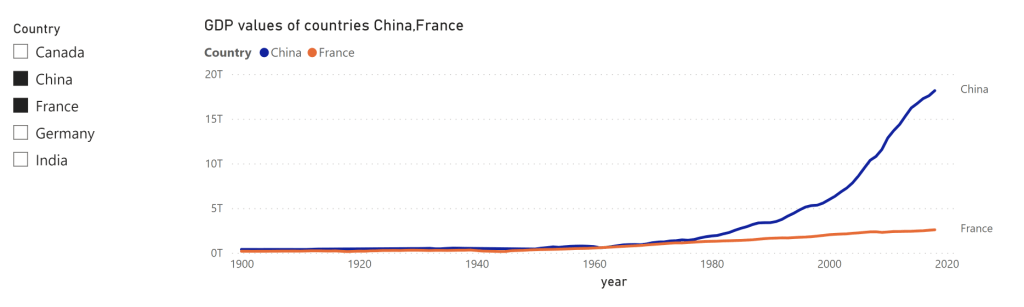
Instead of enabling legend, we may enable axis titles, but again for average, it automatically chooses a country based on sort order. This approach is good as long as you don’t want a legend.
Alternative to legend
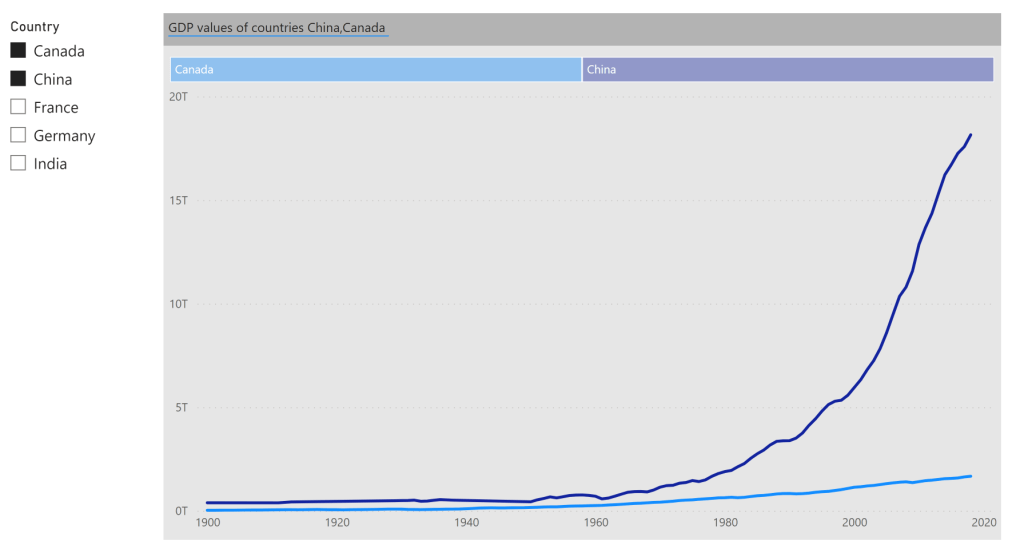
The following approach is to find an alternative to legend. Instead of showing a legend, I make a copy of the visual, convert it into a tree map, and use it as a legend. Same logic as I blogged here – https://prathy.com/2022/06/using-tree-map-as-legend-on-a-page-in-power-bi/
Make a few more changes. Instead of using the Title on the Line chart, add a text box and show the Title. Group all three visuals and backgrounds to give the illusion of a single visual.
When a user lands on this page, it shows the average GDP value by default. When a value is selected in the slicer, it shows only that country. For usability, I have enough signifiers like Title and legend colour.
I hope this inspires someone out there. Until next time
Prathy 🙂